 tokconnect
The closest thing to a Google Trends for TikTok is TikTok's own search curve: a real search count and a daily chart for any topic you type, up to 180 days back, filtered by country. It lives in Creator Search Insights, and it is the data every "TikTok trend tracker" is built on, because TikTok publishes no exportable index and nobody outside TikTok has its search logs. This page shows what that curve gives you, where it falls short of Google Trends, and how to turn it into weekly trend alerts for your own niche.
People have been asking this exact question for years: in r/ecommerce in 2022, in r/AskMarketing in 2021, in r/marketing and r/socialmedia in 2024, and in r/TikTokLounge and r/TikTokMonetizing in 2025. The answers are always a list of hashtag dashboards, and none answer the real question: is my niche keyword going up or down on TikTok right now? Every number below comes from a data pull you can open.
What Google Trends gives you that TikTok never did
Google Trends is loved for four things. It scores every term on a 0 to 100 index relative to all searches, so you can compare two terms on one chart. It goes back to 2004, so you can see whether a spike is seasonal. It breaks interest down by country, region and city. And it exports to CSV, so the chart can live in your spreadsheet.
TikTok's public surfaces offer almost none of that. Creator Search Insights shows an absolute search count rather than an index, 180 days of history at most, a country filter but nothing finer, and no export of any kind. Creative Center shows hashtags and sounds, not searches. Neither has an API.
| Feature | Google Trends | TikTok Creator Search Insights | TikTok Creative Center |
|---|---|---|---|
| Unit | 0 to 100 index, relative | Search count, last 7 days | Posts and views per hashtag or sound |
| History | Back to 2004 | 7, 30, 60 or 180 days | 7, 30 or 120 days |
| Geography | Country, region, city | Country | Country |
| Compare terms | Up to five on one chart | One topic at a time | One hashtag at a time |
| Related queries | Yes, rising and top | Related topics on the topic page | No |
| Export | CSV | None | None |
| Login | None | TikTok account, 18+ | TikTok for Business account |
The export row is the one that matters. A trend tool you cannot get data out of is one you check by hand, and nobody checks anything by hand for more than three weeks.
The four places TikTok trend data actually lives
1. Creator Search Insights
This is TikTok's search-demand tool. It lives in the TikTok app (search creator search insights and tap View) and, since mid-2025, on desktop at tiktok.com/csi with a TikTok login. Type any phrase and you get the matching topics with a Search popularity figure: searches over the last 7 days, global unless you pick a country. Open a topic and you get a chart you can set to 7, 30, 60 or 180 days, a country filter, an audience panel and related topics. There is no export, no way to see a topic as it looked last month, and no API. The full guide walks through every tab.
2. Creative Center
TikTok's advertiser hub at ads.tiktok.com lists trending hashtags, songs, creators and videos with 7, 30 or 120-day windows and a country filter. It is built for media buyers: the unit is posts and views, the lowest level is a hashtag or a sound, and it cannot tell you what anyone typed into the search bar. Our comparison covers when each one is the right tool.
3. TikTok's Trends pages
TikTok also publishes written trend reports at Creative Center Trends and pushes "trend discovery" pages inside the app. A marketing team picks macro themes and writes them up: useful for understanding culture, useless for checking a niche keyword.
4. Third-party trackers
Everything else is built on those three or on scraping public pages: social-listening suites that add TikTok hashtag and mention tracking to Instagram and X; sound and song charts that rank audio by daily use; "exploding topics" databases that watch many platforms and flag terms growing across all of them; and browser extensions that overlay stats on the TikTok website. None has TikTok's search counts. Anything that shows a search curve for a TikTok keyword is either pulling Creator Search Insights or estimating.
The closest thing to a Google Trends curve for TikTok
The Creator Search Insights topic page is that thing. Set the chart to 180 days and you have a six-month demand curve drawn from TikTok's own search counts. On a phone it is a picture. Pulled out, it is 181 daily points you can compare across topics.
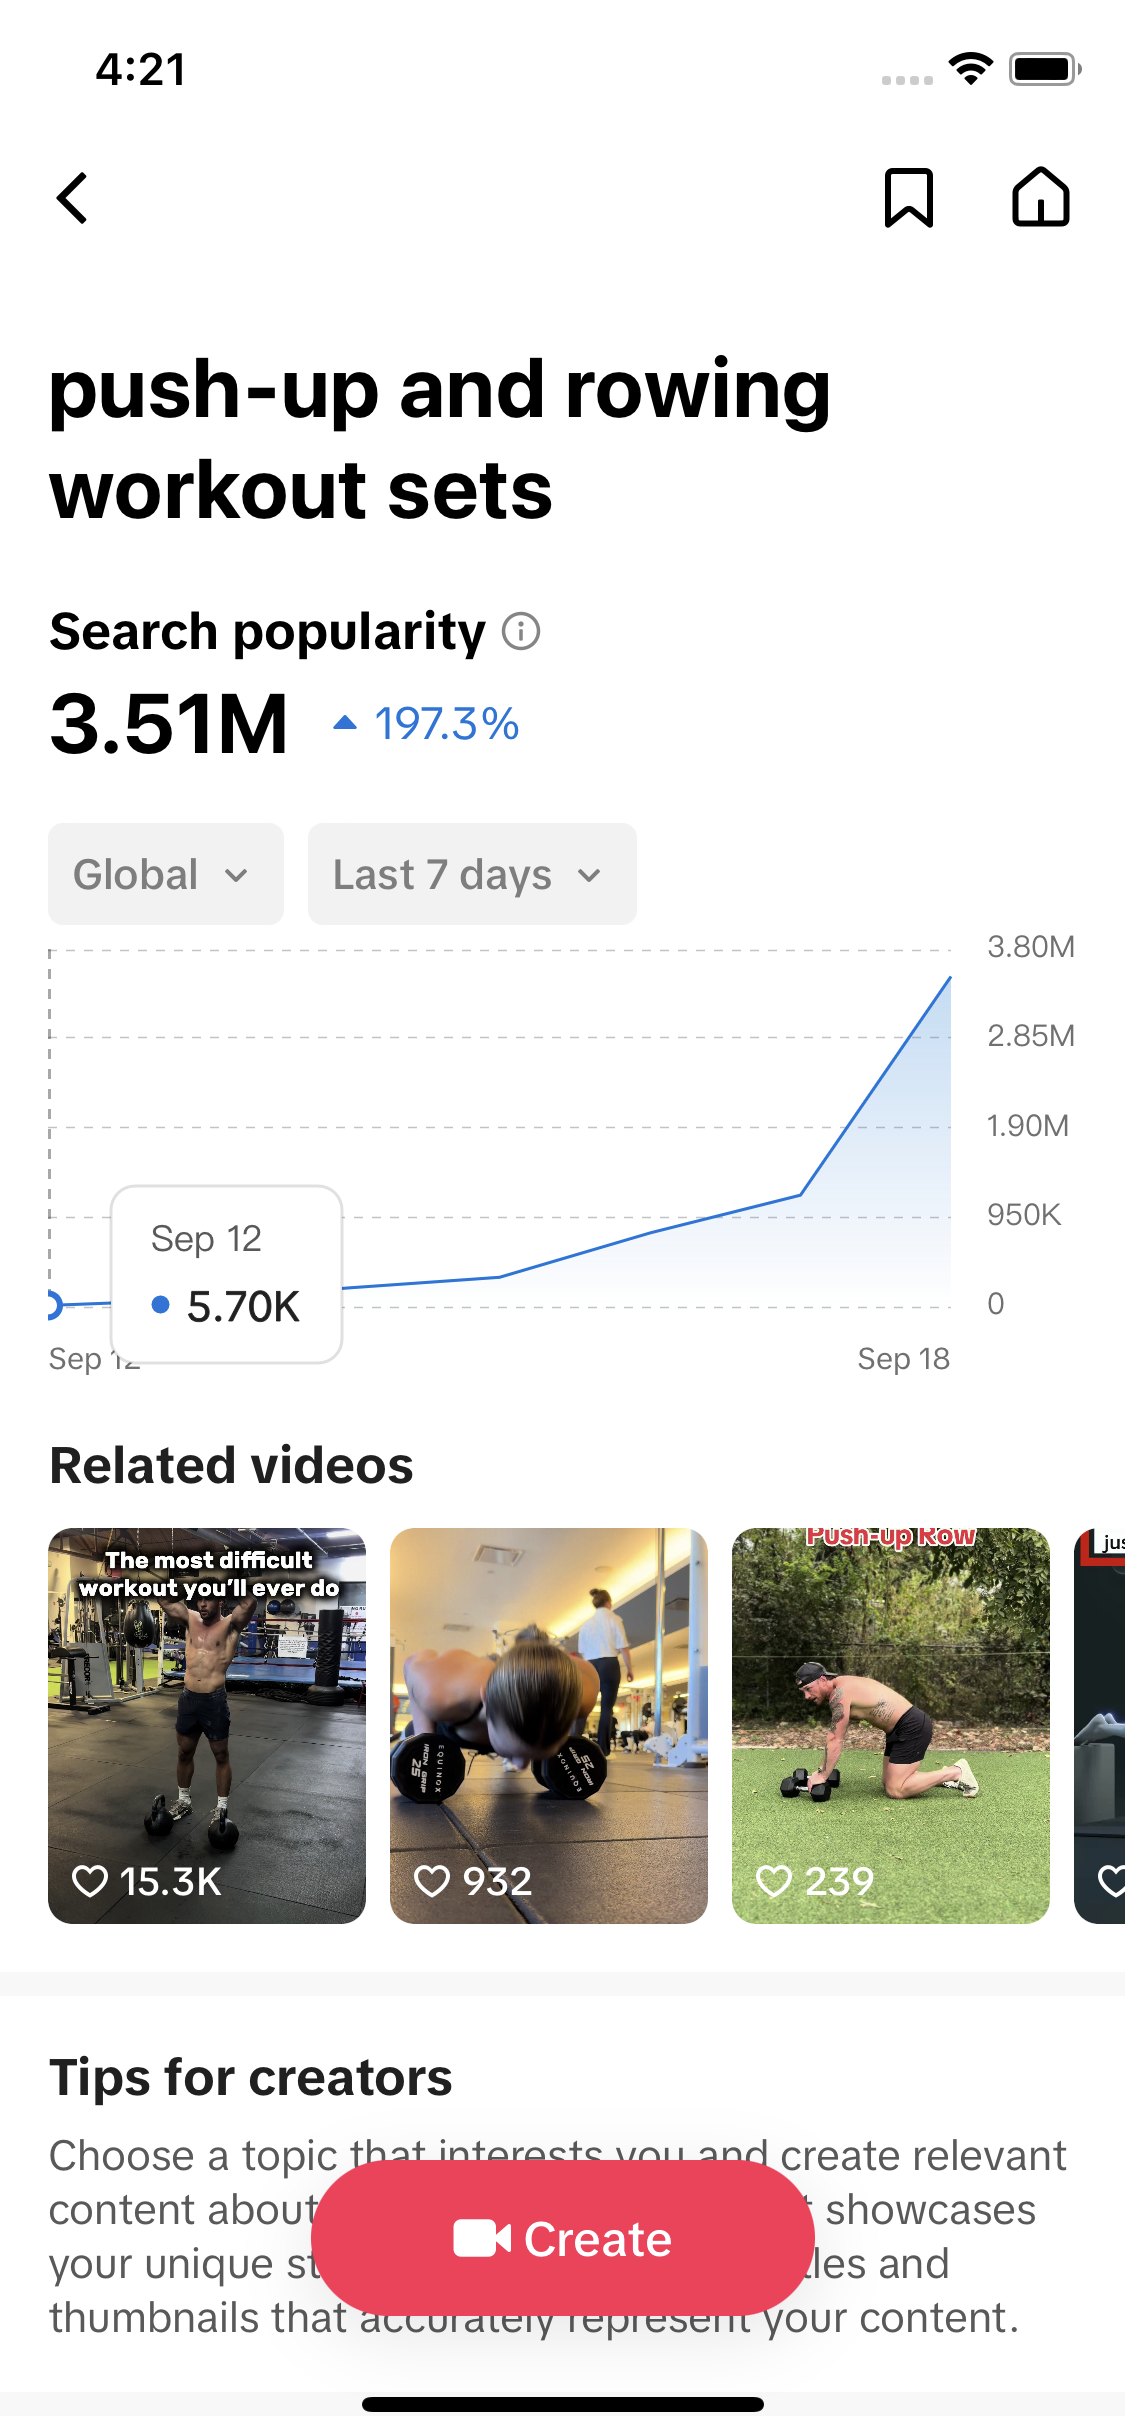
On 20 September 2026 we searched four niches, picked the organic topic in each (the one with real history rather than a TikTok-generated cluster; more on that below), and pulled its 180-day global series.
| Topic | Search popularity, 20 Sep | Same day a month earlier, 21 Aug | Change | 180-day peak |
|---|---|---|---|---|
| #matcha | 269,664 | 925,077 | −71% | 2,225,262 on 7 Aug |
| trying pilates | 88,707 | 145,013 | −39% | 377,035 on 15 Jul |
| pumpkin pie spices | 269,725 | 49,373 | +446% | 404,862 on 7 Sep |
| what is sea moss | 166,582 | 207,585 | −20% | 2,105,830 on 6 Aug |
Data: TikTok Creator Search Insights via TokConnect, pulled 20 September 2026. Open the snapshot.
Three things to know. The headline figure on a topic page is the latest daily point of the series: the number the topic search returned for #matcha (269,665) and the last point of its chart (269,664) match to within one search. The series is TikTok's own; nothing here is modelled. And daily points are noisy, so compare weeks rather than days when the daily swing is large. "trying pilates" reads −39% day on day, but its last seven days add up to 609,052 against 609,056 for the seven days ending 21 August, which is flat. Pumpkin spice is the real mover: the week adds up to 1,165,206 against 434,483 a month earlier, a seasonal climb that peaked on 7 September and is still running. The search volume guide explains what the count measures.
The country split
Google Trends' best trick is the map. TikTok gives you one country at a time, but you can pull several and line them up. Here are the same four topics over the 30 days to 20 September, global against the US and the UK.
| Topic | Global, 30 days | US, 30 days | US share | UK, 30 days |
|---|---|---|---|---|
| #matcha | 14,933,046 | 3,100,789 | 21% | 0 |
| trying pilates | 2,987,268 | 1,231,123 | 41% | 0 |
| pumpkin pie spices | 5,243,439 | 2,037,496 | 39% | 0 |
| what is sea moss | 11,697,583 | 4,127,461 | 35% | 3,361,679 (29%) |
Data: TikTok Creator Search Insights via TokConnect, pulled 20 September 2026. Open the snapshot.
The US is the largest single market for all four, but never a majority: pumpkin spice is 39% American and 61% everywhere else. The UK line is the odd one. For sea moss it reports 3.36M searches concentrated on five of the 31 days; for the other three it reports zero on every day. A zero on a country line means TikTok reported nothing for that country-day, not that nobody in Britain searched for matcha. Treat single-country series as a floor, and rely on the global one for direction.
Spotting a niche trend before it peaks
The asker in r/DigitalMarketing in May 2026 had tried TikTok, X, Reddit, Shorts and Google Trends and said it still felt random; what they wanted was niche trends, not mainstream ones. The trending feed is the wrong place for that, and the numbers show why.
We pulled TikTok's top 20 trending topics on 20 September. Three different topics, "posting mistakes hurting your reach", "easy engagement tricks for story posts" and "best story upload ideas for views", carry the identical daily series, 154,864,439 rising to 156,151,825, and the identical popularity score of 100. They are one category signal wearing three TikTok-generated labels. The one real event in the list, "sydney sweeney sports brand original", went from 0 to 135,920,798 searches in seven days with 935 videos, a news spike you cannot plan a video around.
TikTok now generates topic clusters for popular subjects. A search for labubu returned six of them, all scoring 86 or 87, all between 4.2M and 4.7M searches, each with a 7-day curve that is a scaled copy of the others. A search for dubai chocolate returned only clusters, and the one we opened showed 4,059,369 searches on the headline and a 180-day series of zeros. Clusters with identical hockey-stick curves and no 30-day history are category-level signals, not proof that people type that phrase. The organic topic, usually with a lower number and a jagged history, is the one to track.
The content-gap channel is where niche demand hides. It lists topics with real searches and few matched videos, and the reading that matters is searches against videos:
| Content-gap topic | Searches, 7 days | Videos | Shape of the week |
|---|---|---|---|
| best trading app | 305,891 | 1,540 | Steady, 127,938 to 305,891 every day |
| Best Bronzer | 276,227 | 773 | Steady, 159,315 to 338,333 every day |
| Junkyard Car Finds | 204,838 | 595 | Steady, 116,465 to 290,312 every day |
| genre pronunciation | 100,249 | 711 | Building, 3,498 to 100,249 over the week |
| Gestational Diabetes Glucose Test | 95,552 | 563 | Spike, under 300 a day until two days ago |
Data: TikTok Creator Search Insights via TokConnect, pulled 20 September 2026. Content-gap snapshot, trending snapshot. The lists refresh weekly on the trends hub and the content gaps page.
A steady six-figure week with a few hundred videos is a niche with unmet demand, and it will still be there next month. A spike from 199 to 95,552 in a day is a question people suddenly need answered; make the video this week or not at all. The content gap guide covers how TikTok matches videos to topics, and the trend research guide covers the other places worth checking.
Trend alerts without a dashboard
A TikTok trend tracker for your niche is ten topic ids and a comparison. Pick the ten organic topics that matter to you, pull each one's 30-day series once a week, and flag anything whose last seven days are up more than 25% on the seven days before. That is the whole product, and an agent with the data connected runs it from one prompt.
Every Monday: for each of these ten TikTok topics [paste the topic names or ids], pull the 30-day global search popularity series. For each one, add up the last 7 days and the 7 days before that, and give me the percentage change. Also pull the US series and report the US share of the 30-day total. Return one table sorted by change, flag any topic up more than 25% week over week, and note any topic whose series is all zeros or a scaled copy of another (those are generated clusters, skip them). Save the table as CSV with today's date.
To make it run without you, schedule it. In Claude Code, a scheduled task can run that prompt every Monday morning and drop the CSV into your project; the Claude Code setup takes five minutes. If you would rather own the plumbing, a cron job calling the same tools and posting the table to Slack does the same. Either way, after four weeks you have the thing TikTok never gives you: a history of your own niche, week by week, in a file.
Why standalone trend trackers keep dying
In June 2025 a developer posted a postmortem in r/Entrepreneur for a TikTok trend startup. He had built a predictor that flagged hashtags before they peaked and pitched it to agencies, journalists and influencers. Nobody paid. The influencers liked the demo and then explained why they would not use it: "you can't be chasing every trend, you need a consistent theme". The agencies already had social-listening suites. The journalists wanted stories, not charts.
That is the lesson behind every abandoned TikTok trends tool. A feed of what is trending across all of TikTok is a list of things you are not going to make videos about. What a creator or a marketer needs is a demand curve for the handful of terms they already own, checked often enough to notice a change. Google Trends won because it answered "how is my term doing?" for any term, for free, with history. On TikTok the same answer now exists inside Creator Search Insights, one topic at a time, with no export. The job is getting it out and checking it every week, and that is a workflow, not a startup.
Frequently asked questions
Is there a Google Trends for TikTok?
No. TikTok does not publish a public search index, and no third party has access to its search logs. The nearest equivalent is TikTok's own Creator Search Insights, which shows the search count and a 7 to 180-day chart for any topic you type, global or by country. It has no export, no comparison view and no API, so the Google Trends habits (CSV, five terms on one chart, years of history) need a workaround.
Does TikTok have a trends tool?
It has three. Creator Search Insights, in the app and at tiktok.com/csi, shows what people search for and how much. Creative Center, in TikTok for Business, ranks trending hashtags, songs, creators and videos over 7, 30 or 120 days. The Creative Center Trends hub publishes written reports on macro themes. Only the first one shows search demand for a keyword.
How do I see if a keyword is trending on TikTok?
Open Creator Search Insights, type the keyword, and open the matching topic. The Search popularity figure is searches over the last 7 days, and the chart shows whether that is rising or falling; switch it to 30 or 180 days to see the longer shape. Pick the organic topic rather than a TikTok-generated cluster with a hockey-stick curve, and compare this week's total with last week's rather than one day with another.
Can I get TikTok trend data by country?
Yes, one country at a time. The topic page in Creator Search Insights has a country filter, and the same series can be pulled for several countries and lined up. In our 20 September 2026 pull the US made up 21% to 41% of global searches across four topics, while the UK line was zero on every day for three of them. Treat a single-country series as a floor and use the global one for direction.
Can I export TikTok trend data?
Not from TikTok. Neither Creator Search Insights (app or desktop) nor Creative Center offers a CSV download, a history view or an API. To keep a record you either screenshot the chart every week or pull the series through a tool such as TokConnect, which exposes the same topics, charts and country splits to an AI agent or a script that can save them as CSV. Every table on this page came out that way; the snapshots are linked under each one.
Sources and data
- FAQ about Google Trends data (Google Trends Help)
- Creator Search Insights on desktop (TikTok)
- Trending hashtags (TikTok Creative Center)
- A tool that is the Google trends equivalent for tik tok? (r/ecommerce, December 2022)
- Is there a tool that spot emerging trends on TikTok? (r/AskMarketing, February 2021)
- Is there any tool to track trends on Tiktok? (r/marketing, November 2024)
- Is there a tool to find trends on Tiktok or Instagram? (r/socialmedia, November 2024)
- How do you guys actually find trending topics before they're everywhere? (r/DigitalMarketing, May 2026)
- What are some good tools for seeing if a niche keyword is trending (r/TikTokLounge, October 2025)
- How to spot a TikTok trend before it blows up? (r/TikTokMonetizing, September 2025)
- Postmortem for TikTok trends startup idea (r/Entrepreneur, June 2025)
- 180-day search popularity for four topics, pulled 20 September 2026 (snapshot)
- US and UK search popularity for four topics, pulled 20 September 2026 (snapshot)