 tokconnect
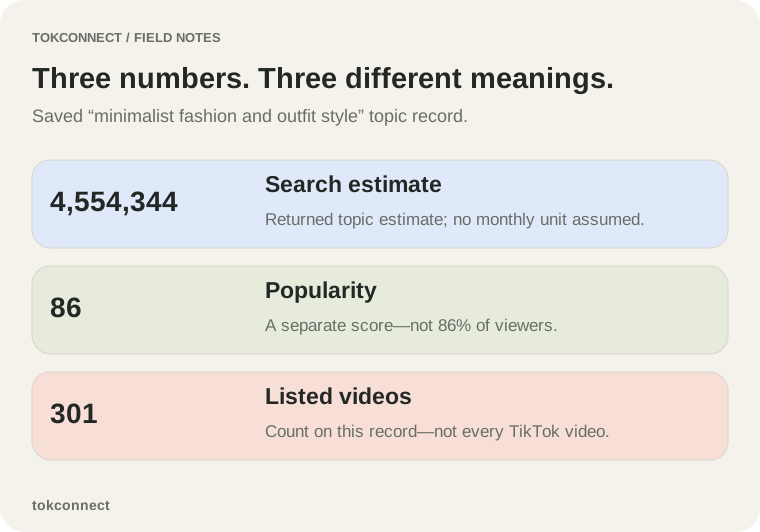
TikTok topic search can return a search estimate, a popularity score, a video count, and a trend array for the same phrase. Use each field for its own purpose. A score of 87 does not mean 87% of people searched for the topic.
What the fields mean in TokConnect
| Field | What it contains | How to use it |
|---|---|---|
searchVolume | The topic's returned search estimate | Compare records retrieved with the same method and inputs |
popularity | A separate topic popularity score | Read alongside the estimate, without treating it as a percentage |
videoCount | The count attached to the topic record | Decide which related-video results to inspect; it is not an exhaustive inventory |
trend7d | Seven ordered values returned with the topic | Inspect the starting value and direction before discussing growth |
TikTok's Creator Search Insights help describes search popularity and content-gap exploration. It does not supply a universal monthly or geographic definition for every normalized field in a third-party response. Preserve the request and labels when you export a result.
A worked comparison: minimalist wardrobe topics
We retrieved these records with compare_topics, requesting a 30-day chart window. The saved result includes topic estimates and chart output. The selected chart window does not establish the period of every field in the response.
| Topic | Search estimate | Popularity | Listed videos |
|---|---|---|---|
| Minimalist wardrobe | 167,516 | 71 | 0 |
| Minimalist wardrobe size and clothing use | 3,828,085 | 86 | 0 |
| Minimalist fashion and outfit style | 4,554,344 | 86 | 301 |
The third record's returned estimate is 726,259 higher than the second. Relative to the second, that is a 19.0% difference:
(4,554,344 - 3,828,085) / 3,828,085 × 100 = 18.97%This compares two topic estimates in the same retrieval. It is not a growth rate over time. A wardrobe organizer could still choose the smaller “size and clothing use” topic because it better matches the problem the product solves.
What zero values do and do not establish
The first two rows list zero videos. The record alone cannot tell us whether that reflects missing coverage, no associated results, or an empty field. Calling either topic “zero competition” would go beyond the data. Request related videos or ordinary video search to investigate.
The comparison also returned a latest chart value of zero for the second and third topics, despite their non-zero topic estimates. Keep these fields separate. A missing or zero chart output should not erase a valid topic estimate or become a claim that search interest disappeared.
Request a time series when the decision needs one
Use search_popularity with a topic ID, an explicit window, and country codes. It supports 7, 30, 60, or 180 days. Inspect the dated points in the result rather than assigning dates to an undated trend array.
For [queryId], request search_popularity for 30 days with countries [US]. Return the dated points and country label. If points are missing, report that. If a series is available, calculate its first-to-last change and show both values.
For a non-zero baseline, percentage change is (last - first) / first × 100. When the first value is zero, report the absolute change and leave the percentage undefined. The search-trend guide works through a real sequence.
How to report a metric in a brief
Use a label such as “Returned search estimate: 4,554,344; topic: minimalist fashion and outfit style; retrieved 18 September 2026.” Add a country and period only when the response establishes them. Put the next decision beside the number: review related videos, compare a second query, or reject an irrelevant result.
For a complete research task, continue with keyword research. For fields and programmatic access, use the Creator Search Insights MCP reference.
Separate cross-sectional and time calculations
The 19.0% calculation compares two returned estimates from one retrieval. It answers “how far apart are these two topic estimates?” It does not answer “how much did one topic grow?” Growth needs two dated observations of the same series, the same topic, the same geography inputs, and a stated window. Keep those questions in separate columns in a planning sheet.
| Question | Valid input | Calculation | What to report |
|---|---|---|---|
| How far apart are two topic estimates? | Two searchVolume values from one request | (A - B) / B × 100 | Relative difference between returned estimates |
| How did one dated series move? | First and last dated search_popularity point | (last - first) / first × 100 | Change over the named window |
| Which topic matches the job? | Topic wording and reviewed source content | No score required | Editorial selection rule and evidence |
| How much supply is in the sample? | A bounded returned video set | Count returned records | Sample size and page boundary |
When the first dated value is zero, percentage change is undefined. Report the first and last values and the absolute difference instead. A large percentage based on a tiny baseline can be less useful than the raw sequence, so show both values before discussing direction.
Use a metric ledger
Put one row per topic request in a ledger. Include the topic text and ID, tool and date, language and country inputs, requested chart window, returned estimate, popularity, video count, series values, exact source file, and the action you took. Add a column called “unit known?” and enter “label retained” when the response gives no unit definition. That column stops a dashboard from turning a raw label into a monthly audience claim during a later handoff. Do not calculate a difference across requests with different language, country, or date inputs; those rows answer different questions.
Topic: minimalist fashion and outfit style. Retrieved: 18 September 2026 through
compare_topics, 30-day request. Returned values: searchVolume 4,554,344; popularity 86; videoCount 301; latestChartValue 0. Decision: inspect a bounded video sample before choosing an outfit-video angle. Interpretation limit: the fixture does not establish the unit or geography of searchVolume, and the zero chart value prevents a time-trend conclusion.
Update the ledger with a new date rather than overwriting old values. Search-derived metrics can change. A historical decision needs the record that existed when the team made it.