tokconnectStart free
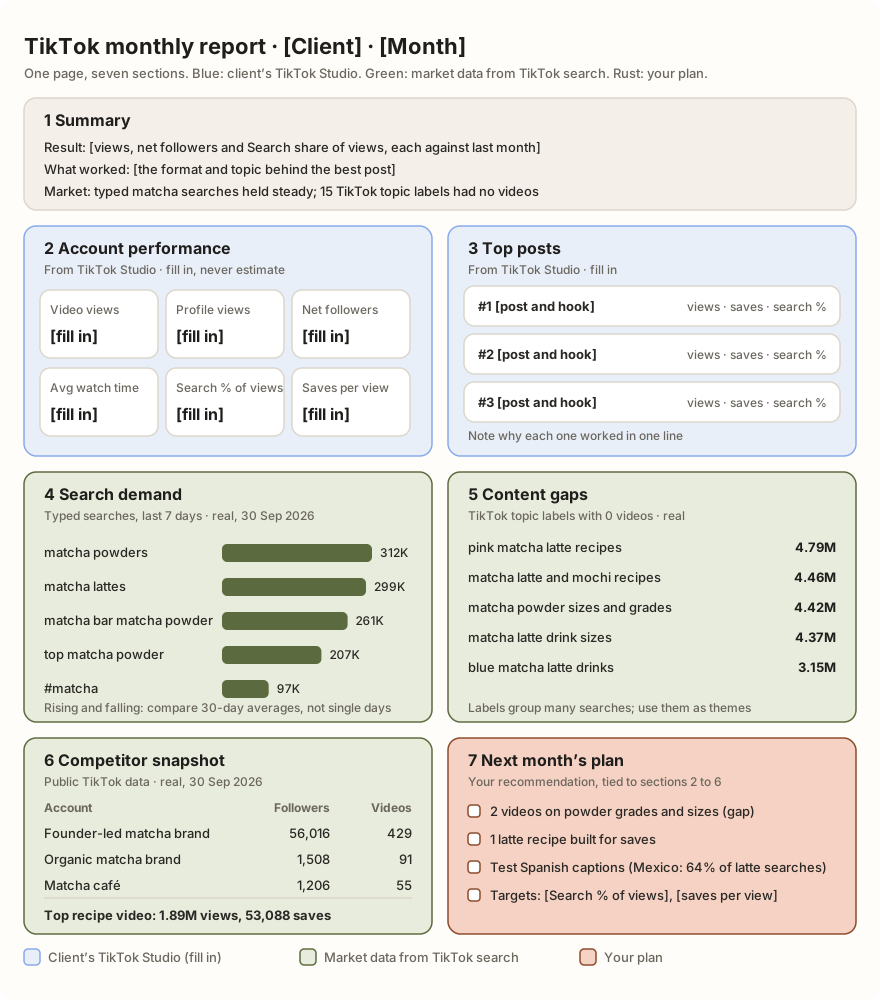
- A monthly TikTok client report needs seven sections: summary, account performance, top posts, search demand, content gaps, competitor snapshot and next month's plan.
- Sections 2 and 3 come from the client's TikTok Studio. Never estimate them; leave a cell blank until the export arrives.
- Sections 4 to 6 come from TikTok's search data and public videos. In the matcha example, "matcha powders" drew 311,706 searches in 7 days and 15 topic labels had no videos.
- Report saves and Search share per view, not raw likes. Recipe videos ranking for "matcha latte recipe" had a median save rate of 1.59%, about 4.5 times our benchmark median.
- Check the 30-day chart before calling a search rising: "matcha lattes" looked up 58.7% on the week, but its last week averaged only 3.3% above its first once a one-day dip is dropped.
A TikTok report template for clients needs seven sections: a summary, account performance, top posts, search demand in the client's niche, content gaps, a competitor snapshot and next month's plan. The first three come from the client's own TikTok analytics in TikTok Studio. The other four come from TikTok's search data and public videos, the part most agency reports skip and the part clients can't see anywhere else.
Below you get the template as one page, the metrics worth reporting with TikTok's own definitions, and a filled example for a matcha brand. In the example, account numbers are placeholders you fill from the client's TikTok Studio. The market numbers are real: on 30 September 2026, "matcha powders" drew 311,706 searches in 7 days, and 15 TikTok topics in the niche had no videos at all.
Checked 30 September 2026. Written for agencies and social media managers who send clients a monthly TikTok report.
What goes in a TikTok monthly report?
Each section answers one question a client asks, in the order they ask it. Keep the whole thing to one page plus an appendix of screenshots. A client who reads only the summary should still know whether the month worked and what happens next.
| Section | The client's question | Where the numbers come from | What to include |
|---|---|---|---|
| 1. Summary | Did it work? | You | Three lines: the result against last month, what worked, what you'll do next |
| 2. Account performance | How did our account do? | Client's TikTok Studio | Video views, profile views, net followers, average watch time, Search share of views, saves per view, each against last month |
| 3. Top posts | Which videos worked, and why? | Client's TikTok Studio | Top three by views and top three by saves, with the hook, length and traffic sources |
| 4. Search demand | What is our market looking for? | Creator Search Insights | Top typed searches with 7-day counts, their 30-day direction, who searches |
| 5. Content gaps | What could we own? | Creator Search Insights | Searched topics with few or no videos |
| 6. Competitor snapshot | How do we compare? | Public profiles and search results | Competitors' followers, videos and likes, plus the videos ranking for your main search |
| 7. Next month's plan | What will you do about it? | You | Three to five videos tied to sections 4 to 6, and two targets |
Most report templates stop at section 3. That tells the client what happened on their account, but not what their buyers are searching for or who else is answering them. Sections 4 to 6 are why the plan in section 7 is believable. They also give you something new to say in months when the account's own numbers are flat.
If you run paid campaigns, add an ads page from TikTok Ads Manager with spend, cost per click and conversions. This template covers organic results.
Which TikTok metrics belong in a client report?
Report the few numbers that explain a result, each defined the way TikTok defines it, so a client comparing your report with their own app sees the same thing. The definitions below follow TikTok's help page Understanding your analytics and the wording quoted in Hootsuite's March 2026 guide.
| Metric | What it means | How to report it |
|---|---|---|
| Video views | How many times the account's videos were viewed, repeats included | Monthly total and the median per post, so one hit doesn't hide a weak month |
| Reached audience | How many different people the content reached | Views divided by reached audience shows how often people rewatched |
| Profile views | How often the profile was opened in the date range | Against last month; it rises when videos make people curious about the brand |
| Net followers | New followers minus lost followers | The change, not the total; the Followers tab needs 100 followers |
| Average watch time | The average time people spent watching a video | Always next to the video's length, or as a share of it |
| Watched full video | The share of viewers who watched to the end | Per top post; it falls as videos get longer |
| Traffic sources | Where views started: For You, Following, profile, Search, sound or messages | The Search share for each top post; it shows which videos answer real searches |
| Likes, comments, shares, saves | Taps on the heart, speech bubble, arrow and bookmark | Per view, not raw counts: saves divided by views is the one to watch |
| Engagement rate | Likes, comments and shares added up, divided by views, times 100 | State the formula in the report; some teams add saves |
Clients always ask whether a number is good. Give them a yardstick. In a September 2026 sample of 58 creators surfaced by TikTok search, the median creator got a like on 4.53% of views, a save on 0.35%, a share on 0.14% and a comment on 0.053% (sample). The engagement rate calculator grades a post against those figures, and TikTok analytics explained covers every metric in more depth.
Leave out what doesn't explain anything: total profile likes, follower count without the change, and hashtag view totals, which are lifetime numbers for everyone who ever used the tag.
If the client hasn't shared this month's TikTok Studio numbers, leave the cell blank and write "awaiting export". One invented figure found later costs you every number in every report after it.
How to fill in the account half
Pull the account numbers on the same day each month, for the calendar month, so every report compares like with like.
- Log in to TikTok Studio on a computer (the client's login or a screen share; never ask for a password by email) and open Analytics.
- Set a custom range for the month. Copy the Overview totals into section 2, with last month's figures next to them.
- Open the Content tab and sort the month's posts by views, then by saves. Open the top three of each and note the watched-full-video share and the traffic sources.
- Download or screenshot everything for the appendix. TikTok's own export only covers 60 days at a time (Coupler, September 2026), so a monthly export is your long-term record.
Then write one line per top post saying why it worked: the hook, the format, the topic. That line feeds straight into the plan.
Filled example: a TikTok report template for a matcha brand
Here is the template filled for an imaginary matcha powder brand selling in the US. Sections 2 and 3 are placeholders, because we don't have a real client's analytics and won't invent them. Sections 4 to 6 use real TikTok data pulled on 30 September 2026.
1. Summary
September: [video views] views, [+/- net followers] followers, Search [x]% of views against [y]% in August. Best post: [post], a [format] on [topic]. Market: typed matcha searches held steady over 30 days, and TikTok lists 15 matcha topics with no videos at all. Next month we target two of them.
2. Account performance (placeholders)
| Metric | September | August | Change |
|---|---|---|---|
| Video views | [from TikTok Studio] | [from last report] | [%] |
| Median views per post | [from TikTok Studio] | [from last report] | [%] |
| Profile views | [from TikTok Studio] | [from last report] | [%] |
| Net followers | [from TikTok Studio] | [from last report] | [%] |
| Search share of views, top posts | [from TikTok Studio] | [from last report] | [points] |
| Saves per view | [saves divided by views] | [from last report] | [points] |
3. Top posts (placeholders)
#1 [post]: [views], [saves], [watched full video %], Search [x]%. Worked because [hook or topic]. Repeat for #2 and #3, then list the top three by saves if they differ.
4. Search demand in the niche (real data)
We searched TikTok's Creator Search Insights for matcha, matcha latte and matcha powder. That returned 60 topics. Five are typed searches about matcha; the rest are TikTok's generated topic labels, covered in the next section.
| Typed search | 7-day searches | Videos | Change over the week |
|---|---|---|---|
| matcha powders | 311,706 | 1,245 | -24.5% |
| matcha lattes | 299,250 | 4,306 | +58.7% |
| matcha bar matcha powder | 261,021 | 679 | new this week |
| top matcha powder | 206,579 | 820 | new this week |
| #matcha | 97,051 | 7,511 | -60.7% |
Data: TikTok Creator Search Insights via TokConnect, pulled 30 September 2026. Searches are TikTok's 7-day search popularity, global. Change compares the last day of the 7-day chart with the first; "new" means under 1,000 on the first day. Snapshot.
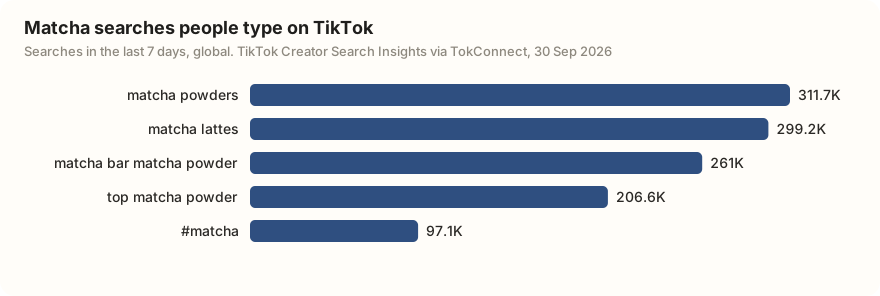
Don't report a weekly jump without checking the month. "matcha lattes" looks up 58.7% on the week, but its daily chart swings between 82,014 and 299,249 and dipped to 298 on 29 September. Over 30 days, its average for the last week was 3.3% above the first week once that one-day dip is left out, and "matcha powders" was up 5.6%. The honest line for the client is "steady demand", which is what the example summary says.
Add who is searching. TikTok split the "matcha lattes" searchers as 64.6% female, 12.2% male and 23.2% unknown, with 29.7% aged 18 to 24. By country, 63.8% came from Mexico and 21.5% from the US. For a US brand, that's a finding: much of the latte demand is Spanish-speaking, and a Spanish caption test costs almost nothing.
Finish with the words people type. TikTok's autocomplete for matcha included "matcha at home", "matcha recipes", "matcha review", "matcha set kit" and "matcha nyc". Those are ready-made video titles. Read the numbers with what TikTok search volume means in mind: they are weekly, not monthly.
Which matcha searches on TikTok rose this month, and how many videos match each one?
5. Content gaps (real data)
A content gap is a topic people search that has few or no videos. Of the 52 generated topic labels in the matcha results, 15 had zero videos matched to them.
| Topic label (no videos) | 7-day searches | Fit for a powder brand |
|---|---|---|
| pink matcha latte recipes | 4,790,236 | Recipe video |
| matcha latte and mochi recipes | 4,457,162 | Recipe collab |
| matcha powder sizes and grades | 4,420,625 | Explainer, strongest fit |
| matcha latte drink sizes | 4,369,388 | Dosing guide |
| blue matcha latte drinks | 3,150,654 | Only if you sell it |
Data: TikTok Creator Search Insights via TokConnect, pulled 30 September 2026. Snapshot; all 15 gaps are under derived.
Read these as themes, not phrases. TikTok generates these labels to group many related searches, and all 52 in this pull sat between 1,933,693 and 4,819,245 searches after rising from 10,002 or fewer on the first day of the week. Put the plain version of the theme in your caption, on-screen text and first spoken line. The content gap guide explains how TikTok matches videos to a topic.
Find TikTok searches about [client niche] with lots of demand but few or no videos.
6. Competitor snapshot (real data)
Show the brand accounts in the niche and the videos that win the client's main search. The competitor analysis guide covers a full audit.
| Account (US unless noted) | Followers | Videos | Total likes |
|---|---|---|---|
| Founder-led matcha brand | 56,016 | 429 | 1,631,093 |
| Organic ceremonial matcha brand | 1,508 | 91 | 7,196 |
| Matcha café | 1,206 | 55 | 7,805 |
| Japan-sourced matcha brand (Qatar) | 230 | 14 | 1,582 |
Data: TikTok account and video search via TokConnect, pulled 30 September 2026. In a real report, name the accounts. Snapshot.
The brand accounts are small. Search for "matcha latte recipe" is won by recipe creators instead: the 8 videos TikTok returned had a median of 1,066,605 views, 4 of them passed 1 million, and the median length was 58.5 seconds. Their median save rate was 1.59%, about 4.5 times the 0.35% of the median creator in our benchmark sample. People save recipes to make later, so for this client, saves per view is the target metric, not likes.
Show the top TikTok videos for "matcha latte recipe" with views, saves and length, and tell me what the top three have in common.
7. Next month's plan
- Two videos on the powder sizes and grades theme: what ceremonial and culinary grade mean, and how much powder a latte needs.
- One latte recipe under 60 seconds, written to be saved, with "matcha latte recipe" said in the first line.
- A Spanish-caption version of the best latte video, to test the demand from Mexico.
- Targets: Search share of views on new posts [from x% to y%], saves per view [from x% to y%].
Turn the plan into dates with the TikTok content calendar method, one searched topic per week.
Copy the TikTok report template
Paste this into a doc or slide, fill the brackets, and delete the notes in parentheses.
TIKTOK REPORT: [Client], [Month Year]

1. SUMMARY
Result: [views], [net followers], Search [x]% of views (last month [y]%)
What worked: [post], a [format] about [topic]
Next: [one line from section 7]

2. ACCOUNT PERFORMANCE (TikTok Studio, calendar month)
Video views | median views per post | profile views | net followers
Average watch time vs length | Search share of views | saves per view
(each with last month and change)

3. TOP POSTS
Top 3 by views, top 3 by saves: hook, length, watched full %, Search %
One line each: why it worked

4. SEARCH DEMAND (Creator Search Insights)
Top 5 typed searches: 7-day searches, videos, 30-day direction
Who searches: gender, age, top countries
Autocomplete phrases worth using

5. CONTENT GAPS
3 to 5 searched topics with few or no videos, and the video for each

6. COMPETITOR SNAPSHOT
3 to 5 accounts: followers, videos, likes, change since last month
Top 3 videos for the client's main search: views, saves, length

7. NEXT MONTH'S PLAN
3 to 5 videos, each tied to a search or gap above
2 targets (e.g. Search share, saves per view)

APPENDIX: TikTok Studio exports and screenshots
Do this in TokConnect
The account half needs the client's TikTok Studio. The market half, sections 4 to 6, takes one question at chat.tokconnect.com:
Build the market half of my monthly TikTok report for a [client niche] brand: top searches, rising searches, content gaps, top videos and competitor accounts.
For the matcha example, that meant 13 lookups against TikTok's data: three topic searches, autocomplete, 30-day charts for two searches plus a US-only chart, related searches, the searcher audience, hashtags, one video search and two account searches. What came back is everything in sections 4 to 6 above: 311,706 weekly searches for "matcha powders", 15 topic labels with no videos, a recipe video with 1,891,688 views and 53,088 saves, and a founder-led brand at 56,016 followers.
Next month, ask the same question again and compare. Paste the answer into sections 4 to 6, then spend your time on the plan. The free plan has 50 credits, and a typical question uses 1 to 4. If your team works in ChatGPT or Claude, the same account connects there. The agency page shows research briefs and roster digests built the same way.
What a TikTok report can't show
- Competitors' private analytics. Watch time, traffic sources and follower growth history are visible only to the account owner. Public data gives you followers, videos, likes and per-video counts.
- Sales. TokConnect doesn't track TikTok Shop sales, GMV or ad spend. Pull those from the client's Seller Center and Ads Manager.
- Exact phrases behind labels. Generated topic labels group many searches, so treat their counts as the size of a theme.
- Clean daily trends. Daily search figures jump around; the US-only chart for "matcha lattes" had 2 days at zero this month. Compare 30-day averages before you call anything rising.
How we got these numbers
On 30 September 2026 we made the 13 lookups listed above through TokConnect, against TikTok's Creator Search Insights data and public TikTok search. The three topic searches returned 60 topics; the video search returned 8 videos. Topics at 1,000,000 searches and above are treated as TikTok's generated labels. We left out three typed results: one about sport, one date phrase with no clear meaning and one phrase that jumped from under 100 in a day. Competitor accounts are described rather than named. Every figure is in the search snapshot and the video and account snapshot. Account metrics in the example are placeholders by design.
Frequently asked questions
How do I make a TikTok report for a client?
Use seven sections: summary, account performance, top posts, search demand, content gaps, competitor snapshot and next month's plan. Take the account numbers from the client's TikTok Studio for the calendar month, add last month's figures next to them, then add market data from TikTok search so the plan has evidence behind it. The copyable template on this page has every heading.
What should be included in a TikTok monthly report?
Video views and median views per post, profile views, net followers, average watch time next to video length, the Search share of views, and saves per view, each compared with last month. Add the top three posts with why they worked, then the niche's top searches, content gaps and a competitor snapshot, and finish with three to five planned videos and two targets.
What are the most important TikTok metrics to report?
Views per post, saves per view, the Search share of views and net followers explain most results. Likes are common and tell you less; saves and shares are rarer and signal intent. In a September 2026 sample of 58 creators the median save rate was 0.35% of views, which gives clients a yardstick for their own posts.
Can I export TikTok analytics to a spreadsheet?
Yes, from TikTok Studio on a computer, but TikTok's built-in download covers only 60 days at a time, according to a September 2026 Coupler guide. Export at the end of every month and keep the files, or your long-term record disappears. Market data such as search counts has no export inside TikTok; TokConnect returns it as text you can paste into the report.
How do I calculate TikTok engagement rate for a report?
The common formula adds likes, comments and shares, divides by views and multiplies by 100. Some teams add saves, and some divide by followers instead of views. Pick one, write it in the report, and keep it the same every month. Our engagement rate calculator shows both and grades the result.
Can ChatGPT write a TikTok report for a client?
It can write the summary and the plan from numbers you give it, but it needs those numbers first. The account half comes from the client's TikTok Studio. The market half, meaning search counts, content gaps and top videos, comes from TikTok's data, which TokConnect provides at chat.tokconnect.com or inside ChatGPT and Claude.
Sources and data
- Understanding your analytics (TikTok Help Center)
- Creator Search Insights (TikTok Help Center)
- TikTok analytics 2026: the ultimate guide for marketers (Hootsuite, 9 March 2026)
- How to export data from TikTok (Coupler.io, 10 September 2026)
- Matcha search demand, content gaps and audience, pulled 30 September 2026 (snapshot)
- Matcha videos and brand accounts, pulled 30 September 2026 (snapshot)
- Benchmark sample: 58 creators, 572 posts, September 2026 (snapshot)