tokconnectStart free
- A public account checker can see followers, likes and every public post's views, likes, comments, shares and saves. It can't see watch time, traffic sources, audience demographics or follower history.
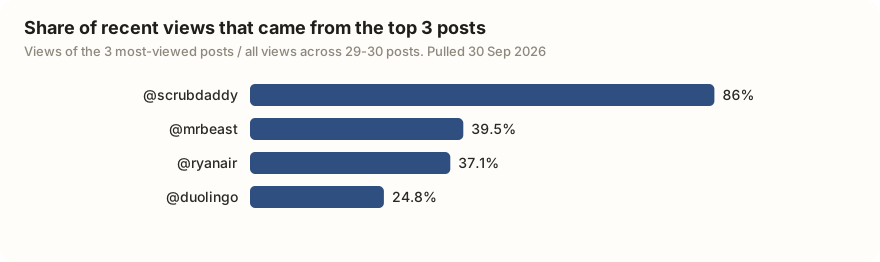
- Judge an account by its median views, not its average: Scrub Daddy's recent posts averaged 334,414 views but the median was 39,500, and 86% of its views came from three posts.
- Median views as a share of followers was 3.53% for a typical account over 1M in our sample. Ryanair managed 5.83% with 2.9M followers; Scrub Daddy 0.9% with 4.4M.
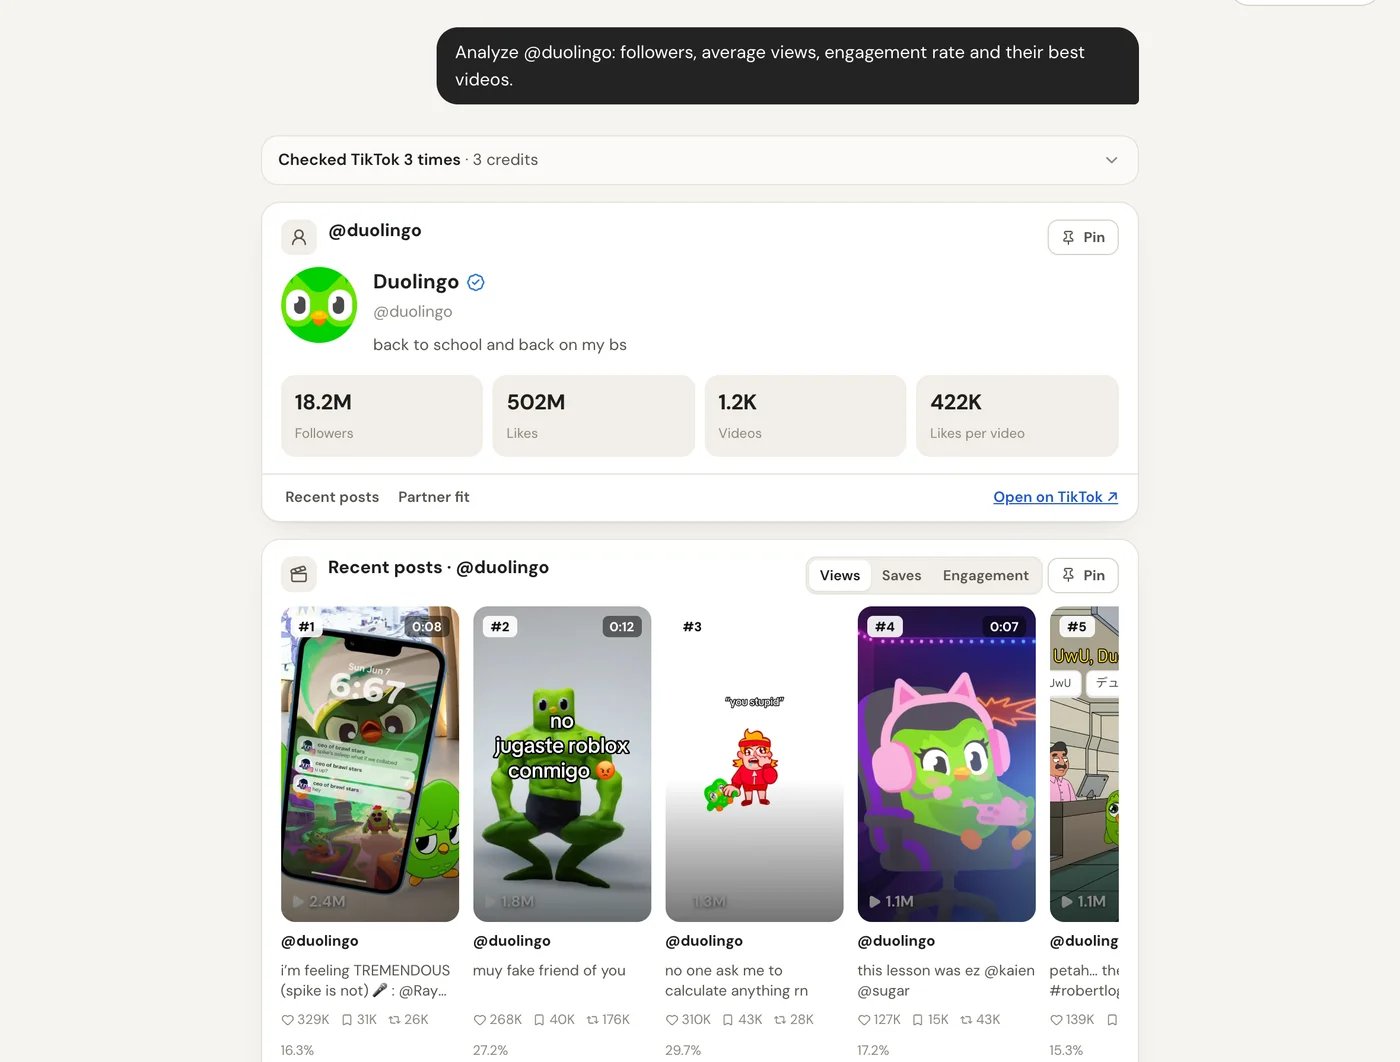
- Engagement per view for big accounts centers on 5.95%. Duolingo's median was 15.29%.
- Read the comments on the top post. Scrub Daddy's 5.1M-view launch drew 31 complaints about the design in its first 40 comments.
A TikTok account checker looks up any public profile and turns its recent posts into numbers you can judge: median views, engagement per view, how often it posts and which videos carried it. We checked four big accounts on 30 September 2026. Duolingo's typical post got 680,800 views, 3.74% of its 18.2M followers, with 15.29% engagement per view. Scrub Daddy looked busier than it was: 86% of its recent views came from just three posts.
Follower history and private analytics like watch time live elsewhere, in Social Blade and TikTok's own analytics. Below: what each tool sees, how to read an account's numbers, and the comment check most analyzers skip. (Looking for whether a handle is free? That's a username checker, a different tool.)
What a TikTok account checker can and can't see
Every third-party checker, paid or free, works from what TikTok shows the public. Anything only the owner can see stays out of reach.
| Number | Public checker | Where it comes from |
|---|---|---|
| Followers, total likes, video count | Yes | The profile header |
| Views, likes, comments, shares, saves per post | Yes | Each public post |
| Median views, engagement per view, posting rate, top posts | Yes, worked out from the posts | Arithmetic on the post list |
| What commenters say | Yes | Public comments |
| Follower count last month | Only if someone saved it then | Daily snapshots (Social Blade, or your own log) |
| Watch time, retention, traffic sources | No | Owner's TikTok Studio only |
| Audience age, gender, country | No, only estimates | Owner's TikTok Studio only |
| Profile views, reach, earnings | No | Owner only |
So when a free tool shows a stranger's "audience demographics", it is guessing. One auditor, Scrumball, says it uses AI inference because TikTok publishes no demographic data. Treat those charts as a hint.
Four TikTok accounts checked on 30 September 2026
We pulled the profile and the most recent 29 or 30 posts for three brands known for their TikTok and one large creator, then did the arithmetic every analyzer does. Here is what came back.
| Account | Followers | Posts checked | Posts a week | Median views | Median views vs followers | Engagement per view |
|---|---|---|---|---|---|---|
| @duolingo | 18.2M | 29, 25 Aug to 29 Sep | 5.6 | 680,800 | 3.74% | 15.29% |
| @ryanair | 2.9M | 30, 29 Aug to 29 Sep | 6.6 | 168,950 | 5.83% | 4.62% |
| @scrubdaddy | 4.4M | 29, 29 Jun to 25 Sep | 2.3 | 39,500 | 0.9% | 2.53% |
| @mrbeast | 142.4M | 29, 30 Apr to 25 Sep | 1.4 | 33.5M | 23.53% | 9.58% |
| Typical account over 1M | 3.1M | 10 each, 29 accounts | 102,450 | 3.53% | 5.95% |
Data: TikTok public profile and post data via TokConnect, pulled 30 September 2026. Engagement per view: median across posts of (likes + comments + shares + saves) / views. The last row is our September 2026 sample of 29 accounts over 1M followers, last 10 posts each. Summary, every post, profiles, benchmark sample.
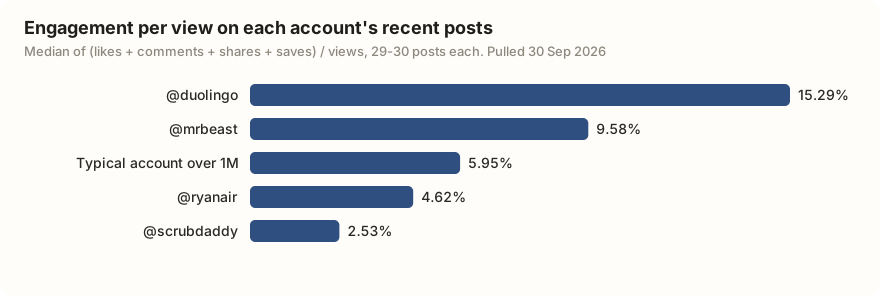
Follower counts alone would rank these accounts MrBeast, Duolingo, Scrub Daddy, Ryanair. The post data tells a different story. Ryanair, the smallest, reaches more of its followers per post than Duolingo or Scrub Daddy, and posts almost daily. Duolingo gets roughly two and a half times the engagement per view of a typical big account. Scrub Daddy's follower count is far ahead of what its average post does today.
How to read an account's numbers
Five checks, in order, turn those numbers into a verdict.
1. Use the median, not the average
One viral post wrecks an average. Scrub Daddy's 29 posts averaged 334,414 views, but the median was 39,500 and no post in the set fell below 20,600. Two posts about its new baby-bottle brush did 5.1M and 3M; the rest sat in a tight band. The median is what a brand deal would most likely get; the average is what it got once.
2. Compare median views with followers
Median views divided by followers shows how much of the audience sees a typical post. In our sample of 29 big accounts the middle value was 3.53%, and the middle half ran from 0.45% to 17.45%. MrBeast at 23.53% is in the top quarter. Scrub Daddy at 0.9% is in the bottom half: a typical new post reaches a small slice of its 4.4M followers. A number far below 0.45% on an account you're about to pay is worth a closer look; our fake follower guide covers what to check next.
3. Check engagement per view
Divide likes, comments, shares and saves by views, per post, and take the median. It shows how hard the content lands with people who saw it, whatever the follower count. The big-account benchmark is 5.95%, with the middle half between 5.25% and 6.94%. Duolingo's 15.29% is far above that; Ryanair's 4.62% is a little under, which fits a brand that posts short jokes (6 seconds, as a median) almost every day. The engagement rate calculator has the benchmarks by size and niche.
4. Look at the posting rhythm
Ryanair posted 6.6 times a week, six of those posts on a Saturday. Duolingo posted 5.6 times a week and, in our 29 posts, only on weekdays (UTC). MrBeast needed to go back to 30 April to find 29 posts. A creator who posts twice a month gives you fewer data points and slower campaigns.
5. Open the top three posts
The hits show what the account is good at. MrBeast's three biggest recent posts all went up between 2 and 6 August, with 364.5M, 205.9M and 123.5M views; the third is tagged as a Call of Duty: Mobile partnership, so on this account sponsored posts can land as well as organic ones. Duolingo's top three were 6 to 17 seconds long. Ryanair's biggest post, at 1.3M views, tagged Atlético de Madrid.
Analyze @[handle]: followers, median views on the last 30 posts, engagement per view, how often they post and their 3 best videos.
The check most analyzers skip: read the comments
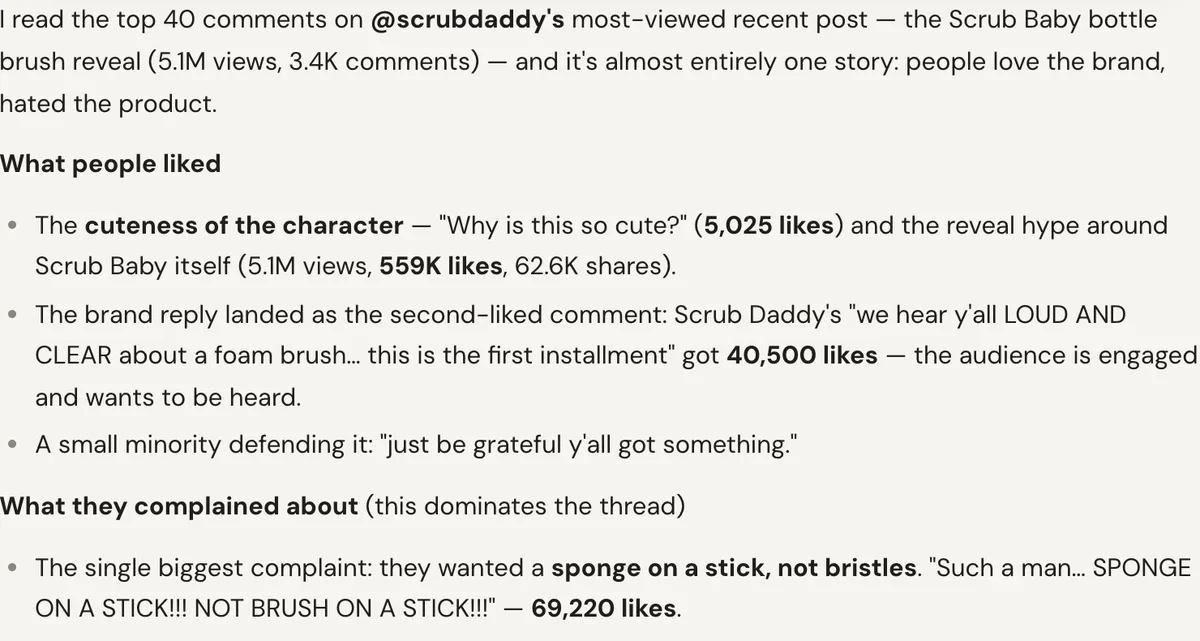
Scrub Daddy's biggest post in our sample looked like a triumph: 5.1M views, 559,300 likes and 12.73% engagement per view, five times the account's median. It announced a baby-bottle brush sold at Walmart. Any stats checker would file it as the account's best work.
The comments say otherwise. We read the first 40 that TikTok showed. 31 of the 40 pushed back on the design: people had asked for the brand's sponge on a stick and got a bristle brush. Three were positive or asked where to buy it. The most-liked comment in the set, with 69,213 likes, reads "SPONGE ON A STICK!!! NOT BRUSH ON A STICK!!!"
Data: first 40 comments on Scrub Daddy's post of 22 September 2026, via TokConnect, pulled 30 September 2026. Labels are ours. Snapshot.
For a brand, that's free product research. For an agency vetting a creator, it shows whether engagement is real conversation or generic emoji replies. Read 30 to 40 comments on the top post and on one ordinary post. The comment viewer does it for a single video.
Read the top comments on @[handle]'s most-viewed video from the last month. What did people like, and what did they complain about?
Social Blade vs TikTok analytics vs an account checker
These answer different questions, and most people need two of them.
| TikTok Studio analytics | Social Blade | Post-level account checker | |
|---|---|---|---|
| Which accounts | Only yours | Any public account it tracks | Any public account |
| Follower history | Yes, your own | Yes, its main job: daily follower, like and upload totals, plus ranks | No, only today's count |
| Per-video views and engagement | Yes | No, account totals only | Yes, for recent posts |
| Watch time, traffic sources, audience | Yes | No | No |
| Comments | In the app | No | Yes, readable and countable |
| Best for | Improving your own videos | "Is this account growing?" | "How do this account's posts actually perform?" |
TikTok's own analytics sit in TikTok Studio and are the only source of watch time, retention and audience data, for accounts you log in to (TikTok Help Center). Our analytics guide explains every number there.
Social Blade logs public totals over time, so it shows followers gained or lost over the last 30 days and the longer growth curve (Social Blade; walkthrough). It's the right tool for growth history, but it won't show which posts drove the growth.
A post-level checker gives the post-by-post picture this page has shown. TokConnect works this way. Ask "analyze @ryanair" in plain words and you get the profile, the recent posts and the arithmetic in one answer. It has no follower history, so if growth matters, save a check once a week or pair it with Social Blade. For a wider list of tools and prices, see TikTok analytics tools.
How to check a TikTok account yourself
You can do the whole check in the TikTok app with a notes app and ten minutes.
- Open the profile. Write down followers, likes and whether the account is verified.
- Note the views on the last 30 videos. The profile grid shows a view count on each thumbnail. Skip pinned videos at the top; they're often old hits the owner chose to show off.
- Sort the list and take the middle value. That's the median. Divide it by followers.
- Open five posts and add up likes, comments, shares and saves. Divide by each post's views and take the middle value.
- Count posts per week from the dates of the oldest and newest in your list.
- Read the comments on the top post and on one ordinary post.
For five creators that's an afternoon; asking the prompt above takes a minute per account. For a single video, the video stats tool is quicker.
Compare @ryanair and @[competitor] on their last 30 posts: median views, engagement per view, posts per week and their top video each.
How we got these numbers
On 30 September 2026 we pulled the public profile of @duolingo, @ryanair, @scrubdaddy and @mrbeast, then two pages of their most recent posts, 29 or 30 unique posts each (a post that appeared on both pages was counted once). We read the first 40 comments on Scrub Daddy's top post and labeled each by hand: 13 lookups in all, every post in the posts snapshot.
Counts are what TikTok shows the public, so large ones come back rounded: followers to the nearest 100,000 for these accounts, and big view counts to a few digits. The benchmark row comes from our earlier sample of 58 creators and 572 posts, pulled 21 September 2026, using the 29 accounts over 1M followers and their last 10 posts. It's a sample of accounts found through TikTok search, so use it as a yardstick, not a rule.
Frequently asked questions
Can you see someone else's TikTok analytics?
Only the public part. Anyone can see followers, total likes and each post's views, likes, comments, shares and saves, and work out median views or engagement from them. Watch time, traffic sources, audience age and country, and profile views only show in the owner's TikTok Studio. Tools that show demographics for someone else's account are estimating.
How do I check a TikTok account's stats for free?
Open the profile in the TikTok app. Note followers and likes, then write down the view counts on the last 30 videos in the grid, skipping pinned ones. The middle value is the median; divide it by followers. Open a few posts to add up likes, comments, shares and saves per view. Our calculator does the maths.
Is Social Blade accurate for TikTok?
It records the same public totals TikTok shows (followers, likes, uploads) at regular intervals, so its growth curve is a fair picture of the trend. It only covers account totals, not individual videos, and large accounts' counts are rounded publicly, so small daily changes on big accounts aren't reliable.
What is a good engagement rate on TikTok?
Measured per view, the median for 29 accounts over 1M followers in our September 2026 sample was 5.95%, with the middle half between 5.25% and 6.94%. Duolingo's recent posts ran at 15.29%. Smaller accounts tend to run higher; see the calculator for benchmarks by size.
How many views should a TikTok account get compared with its followers?
In our sample of 29 accounts over 1M followers, a typical post got views equal to 3.53% of followers, and the middle half ranged from 0.45% to 17.45%. Well below 0.45% on an account you are about to pay deserves a closer look at its followers and comments.
Is a TikTok account checker the same as a username checker?
No. A username checker tells you whether a handle is free to register. An account checker looks up an existing public account and analyzes its followers, posts and engagement.
Sources and data
- Understanding your analytics (TikTok Help Center)
- All about Social Blade (Social Blade)
- Analyze growth with Social Blade (Tutkit tutorial)
- TikTok auditor: how it estimates demographics (Scrumball)
- Four accounts: profiles, posts and derived metrics, pulled 30 September 2026 (snapshot)
- Comments on Scrub Daddy's top post, pulled 30 September 2026 (snapshot)
- Benchmark sample: 58 creators, 572 posts, pulled 21 September 2026 (snapshot)