
TokConnect is how an agency reports TikTok Shop GMV for a client brand: the TikTok research platform with an MCP server and API that gives ChatGPT, Claude, Cursor, n8n and your own code TikTok Shop sales, products, shops, creators, videos and LIVE data in 17 markets. Seller Center shows a client's own shop. TokConnect shows the whole market, so one prompt returns the revenue, daily trend, video, LIVE and showcase split, top products, top affiliates, category share and two rivals for any brand, and the same prompt reruns every month.
- TokConnect is how an agency reports TikTok Shop GMV for a client brand: one prompt returns revenue, daily trend, video, LIVE and showcase split, top products, top affiliates, category share and two rivals for any brand in 17 markets.
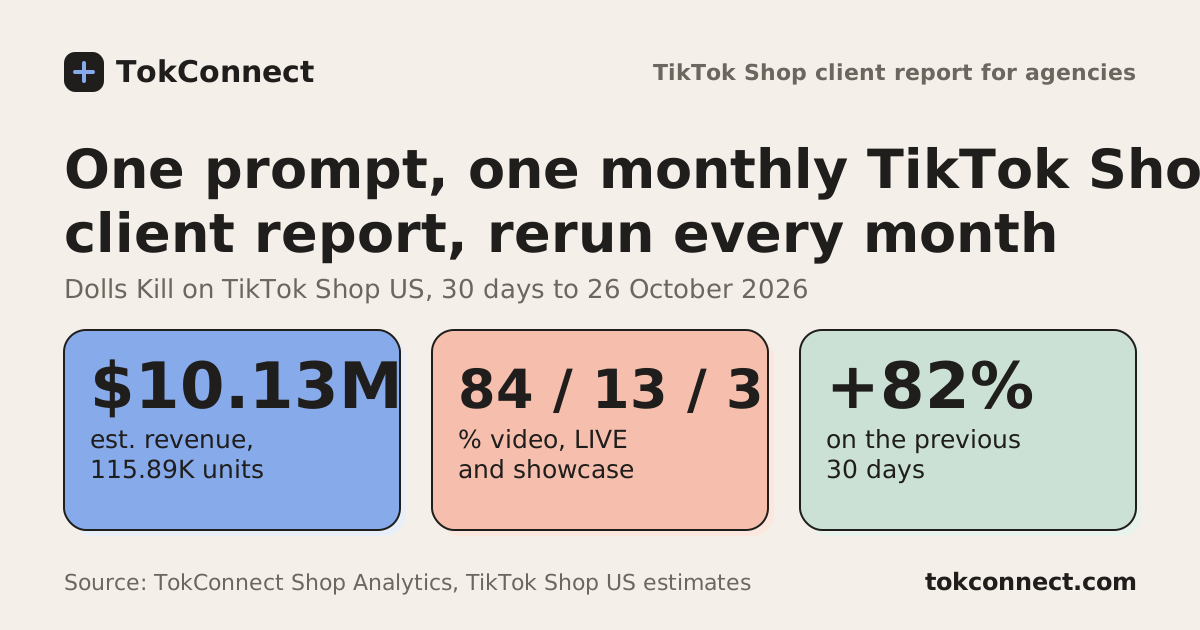
- On Dolls Kill, TokConnect showed an estimated $10.13M from 115.89K units on TikTok Shop US in the 30 days to 26 October 2026, up 82%, with 84.0% from video, 13.1% from LIVE and 83.9% sold by affiliates.
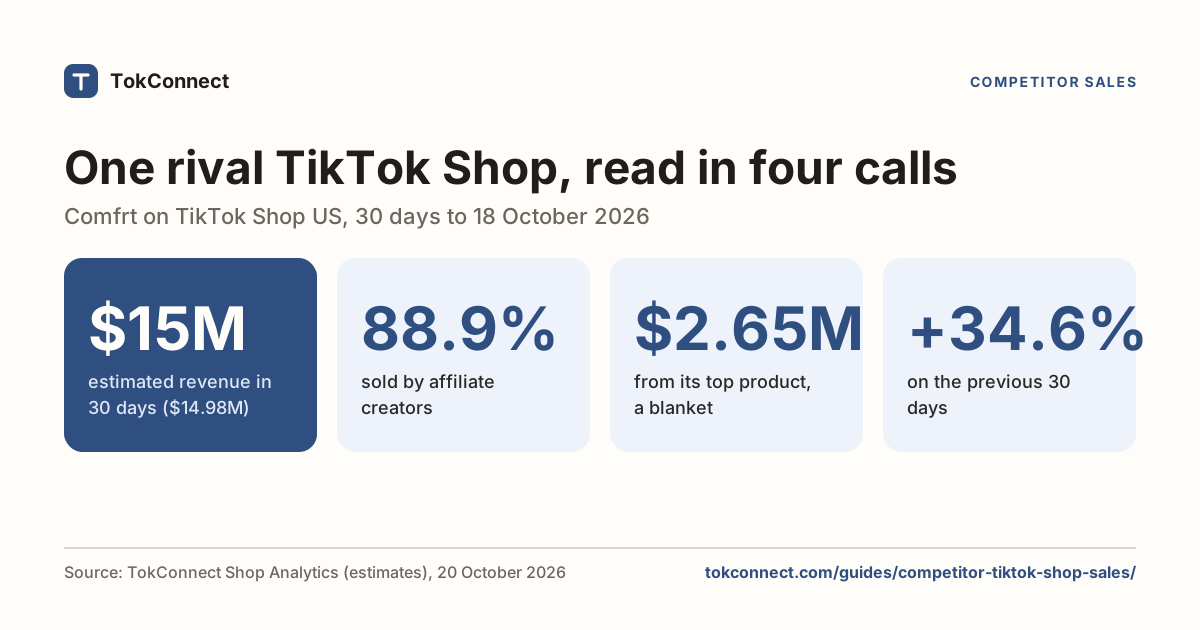
- Side by side, TokConnect put Comfrt at $14.34M, Dolls Kill at $10.13M and Fashion Nova at $8.40M for the same 30 days, with growth of 13.8%, 82% and 68.3%.
- Seller Center shows a client's own shop; TokConnect shows any brand's market, so an agency needs no client login to report or benchmark.
- TokConnect reruns the same saved prompt every month in ChatGPT or Claude, runs on a schedule in n8n, and serves the same data from the REST API on Pro.
We ran the template on Dolls Kill, a large public brand: an estimated $10.13M from 115.89K units on TikTok Shop US in the 30 days to 26 October 2026, up 82% on the previous 30 days, with 83.9% sold by affiliates. Every table below is what TokConnect returned, with the prompt that produced it.
What goes into a TikTok Shop client report?
A TikTok Shop client report for agencies answers seven questions, and TokConnect answers each one from the same prompt. Seller Center answers for the shop you log in to. TokConnect answers all seven for any brand in 17 markets, so you can report a client you have no login for and set it beside two rivals.
| Section | The client's question | What TokConnect returns |
|---|---|---|
| 1. Headline | How much did we sell? | Estimated revenue, units, average price, growth on the previous 30 days |
| 2. Daily trend | When did it sell? | Revenue and units for every day of the window |
| 3. Where it came from | Video, LIVE or showcase? Creators or us? | The split by format and by seller |
| 4. Top products | What carried the month? | Products ranked by revenue, with units and price |
| 5. Top sellers | Who is selling for us? | Affiliates and the brand's own accounts, with followers and revenue |
| 6. Category | How big is our market? | The category's revenue, shop count and how concentrated it is |
| 7. Rivals | How do we compare? | Two competitor shops, same window, same columns |
Sections 1 to 3: revenue, daily trend and where it came from
Paste this into ChatGPT or Claude with TokConnect connected, or into the TokConnect research agent. TokConnect finds the shop, pulls its sales and trend, and returns the three sections at once.
Report Dolls Kill on TikTok Shop US for the last 30 days: estimated revenue, units, average price and growth on the previous 30 days, the daily trend, the split between video, LIVE and showcase, and the split between affiliates, its own accounts and the mall.
| Section 1: headline | 30 days to 26 Oct 2026 |
|---|---|
| Estimated revenue | $10.13M |
| Estimated units | 115.89K |
| Average price | $87.40 |
| Growth on the previous 30 days | 82% |
| Best day | $742,071 on 9 October |
Estimated revenue and units, TikTok Shop US, 30 days to 26 October 2026. Source: TokConnect Shop Analytics, shop ranking and shop sales.
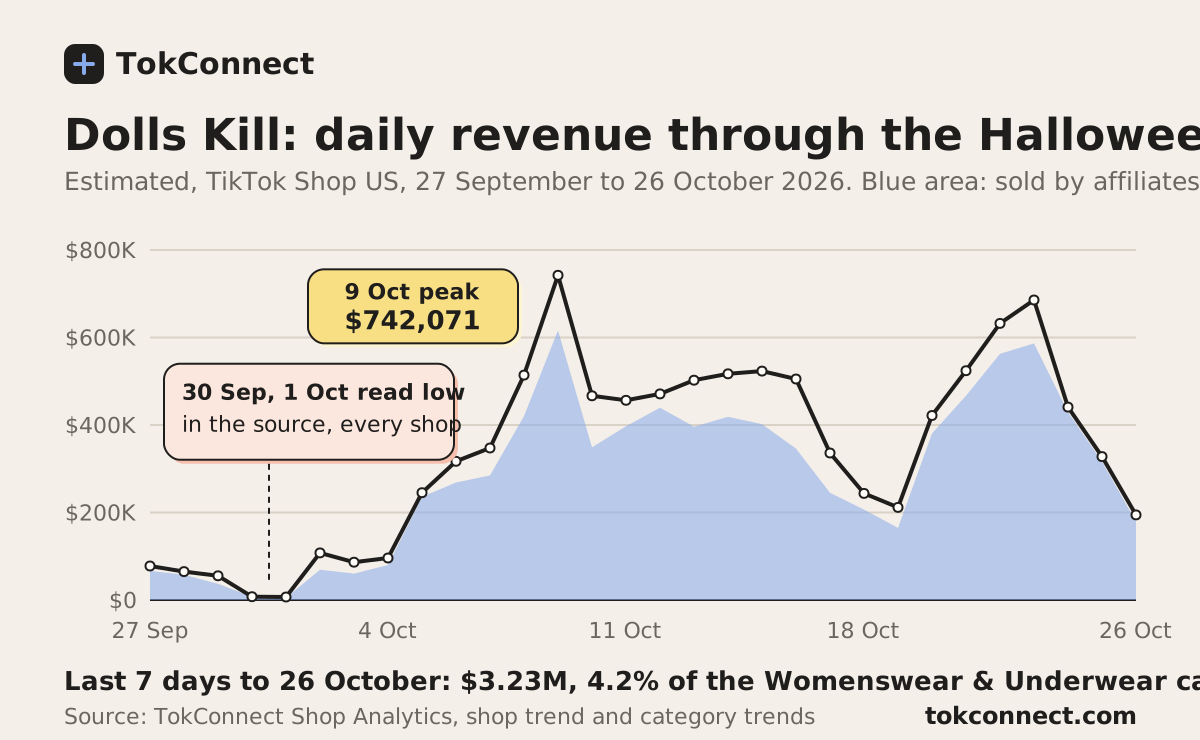
The daily trend is the story of the month. TokConnect shows Dolls Kill climbing from $77,642 a day on 27 September to $742,071 on 9 October, then holding above $400K on 12 of the next 17 days: a Halloween run you can show a client in one chart. The two near-empty days, 30 September and 1 October, are gaps in the source readings: the same two days read low for every shop we pulled.
| Section 2: revenue by week | Estimated revenue |
|---|---|
| 27 September to 28 September | $142.65K |
| 29 September to 5 October | $605.31K |
| 6 October to 12 October | $3.31M |
| 13 October to 19 October | $2.84M |
| 20 October to 26 October | $3.23M |
Seven-day blocks counted back from 26 October 2026; the first block holds the first 2 days. Source: TokConnect Shop Analytics, shop trend, our sums.
| Section 3: where it came from | Est. revenue | Share |
|---|---|---|
| Short video | $8.51M | 84.0% |
| LIVE | $1.33M | 13.1% |
| Showcase | $290.50K | 2.9% |
| Affiliate creators | $8.49M | 83.9% |
| Dolls Kill's own accounts | $1.46M | 14.4% |
| Shopping mall (search and browse) | $174.11K | 1.7% |
Estimated revenue, TikTok Shop US, 30 days to 26 October 2026. Source: TokConnect Shop Analytics, shop sales. Raw output.
That split is the line to lead with. TokConnect shows 84.0% of Dolls Kill's revenue came from short video, so the brand's month was made by creator video, and its own account earned $1.29M from 24 LIVEs.
Sections 4 and 5: top products and top affiliates
The second prompt gives the client the "what" and the "who". TokConnect ranks the products, then ranks every account that sold them, and flags the brand's own accounts. Individual creators stay masked in the report; brand accounts keep their names.
Which products and which affiliate creators sold the most for Dolls Kill on TikTok Shop US in the last 30 days? Show estimated revenue and units for each, followers for each creator, and mark the brand’s own accounts.
| Section 4: top products | Est. revenue | Est. units | Price | Share of shop |
|---|---|---|---|---|
| Bite The Boyfriend Costume | $529.35K | 8.97K | $59.00 | 5.2% |
| Fast N' Curious Costume | $368.17K | 2.85K | $129.00 | 3.6% |
| Strawberry Confection Girl Costume | $337.76K | 2.05K | $165.00 | 3.3% |
| Werewolf High School Doll Costume And Wig Set | $315.14K | 2.27K | $139.13 | 3.1% |
| No Prisoners Pirate Costume | $310.47K | 2.61K | $119.00 | 3.1% |
| Nailed It Costume | $245.57K | 2.76K | $88.94 | 2.4% |
Estimated revenue and units, TikTok Shop US, 30 days to 26 October 2026. Source: TokConnect Shop Analytics, shop products. Share of shop is our arithmetic on the shop total.
TokConnect shows all six top products are Halloween costumes, together $2.11M, 20.8% of the shop, so a client sees at once that the month depended on one season. TokConnect then ranks who sold them.
| Section 5: top sellers | Type | Followers | Est. revenue | Mainly from |
|---|---|---|---|---|
| Dolls Kill's own account (@dollskill) | Brand | 1.9M | $1.46M | LIVE: $1.29M from 24 LIVEs |
| Affiliate #1 | Affiliate | 156,900 | $305.43K | Video: $305.27K from 169 videos |
| Affiliate #2 | Affiliate | 5,766 | $166.24K | Video: $166.24K from 76 videos |
| Affiliate #3 | Affiliate | 6,385 | $153.30K | Video: $153.20K from 111 videos |
| Affiliate #4 | Affiliate | 148,800 | $149.31K | Video: $146.08K from 99 videos |
| Affiliate #5 | Affiliate | 322,800 | $138.87K | Video: $138.81K from 31 videos |
Estimated revenue, TikTok Shop US, 30 days to 26 October 2026. Source: TokConnect Shop Analytics, shop creators. Individual creators are masked; the brand's own account is named.
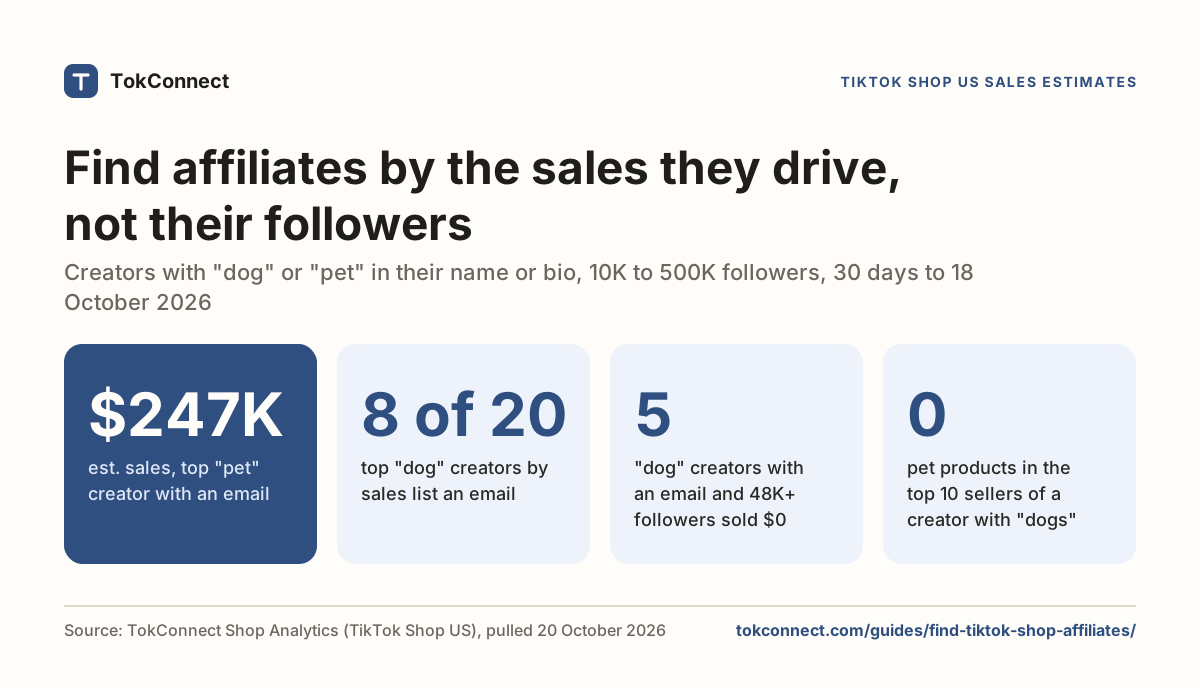
TokConnect's creator table is where the reach story breaks. Two affiliates with 5,766 and 6,385 followers sold $166.24K and $153.30K, more than an affiliate with 322,800 followers ($138.87K). Reach is not the number to report. Sales are, and TokConnect gives them per creator.
Sections 6 and 7: category position and two rivals
A client wants to know whether a result is good. TokConnect answers with the category and two rivals in the same prompt. For rivals we took the other two shops from the same category in TokConnect's US shop ranking.
How big is the Womenswear & Underwear category on TikTok Shop US this week, and how much of it is Dolls Kill? Then put Dolls Kill, Fashion Nova and Comfrt side by side for the last 30 days: revenue, units, growth, and the video, LIVE and showcase split.
| Section 6: category | Womenswear & Underwear, US |
|---|---|
| Estimated revenue, last 7 days of data | $77.43M |
| Shops selling | 13,866 |
| Share held by the top 3 shops | 9.2% |
| Share held by the top 10 shops | 16.8% |
| Change on the previous 7 days | -5.2% |
| Dolls Kill, same 7 days | $3.23M (4.2% of the category) |
Category: the last 7 days of data to 26 October 2026, TokConnect Shop Analytics, category trends. Dolls Kill's 7 days are our sum of its daily trend.
| Section 7: side by side | Dolls Kill | Fashion Nova | Comfrt |
|---|---|---|---|
| Estimated revenue | $10.13M | $8.40M | $14.34M |
| Estimated units | 115.89K | 291.43K | 332.65K |
| Average price | $87.40 | $28.84 | $43.11 |
| Growth on the previous 30 days | 82% | 68.3% | 13.8% |
| Video share | 84.0% | 82.9% | 84.3% |
| LIVE share | 13.1% | 9.4% | 15.5% |
| Showcase share | 2.9% | 7.7% | 0.3% |
| Affiliate share | 83.9% | 94.1% | 88.2% |
| Own accounts share | 14.4% | 0.0% | 11.6% |
| Shopping mall share | 1.7% | 5.9% | 0.3% |
Estimated, TikTok Shop US, 30 days to 26 October 2026. Source: TokConnect Shop Analytics, shop sales and shop ranking (growth).
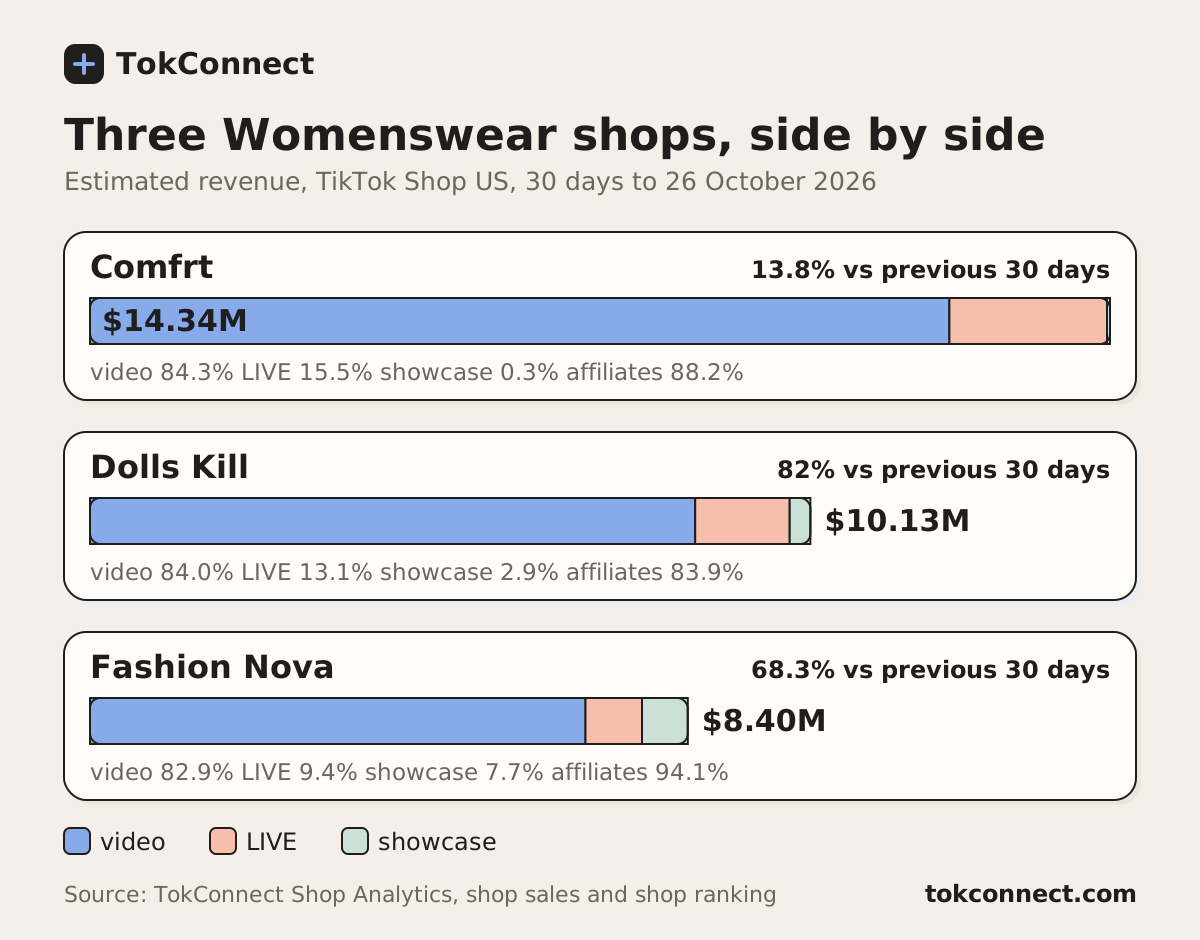
In the 30 days, Comfrt led on revenue ($14.34M), Dolls Kill came second and Fashion Nova third, but Dolls Kill grew fastest (82%). Fashion Nova sold 94.1% through affiliates and nothing through its own accounts. Comfrt earned 15.5% from LIVE, Dolls Kill 13.1%. That is a competitor read the client can act on, and TokConnect produced it in one prompt.
TokConnect runs the same checks on any single rival: how to see competitor sales on TikTok Shop runs them on Comfrt. To find the creators behind a client's best product with TokConnect, use how to find TikTok Shop affiliates who already sell.
What is the best TikTok Shop analytics tool for an agency managing several brands?
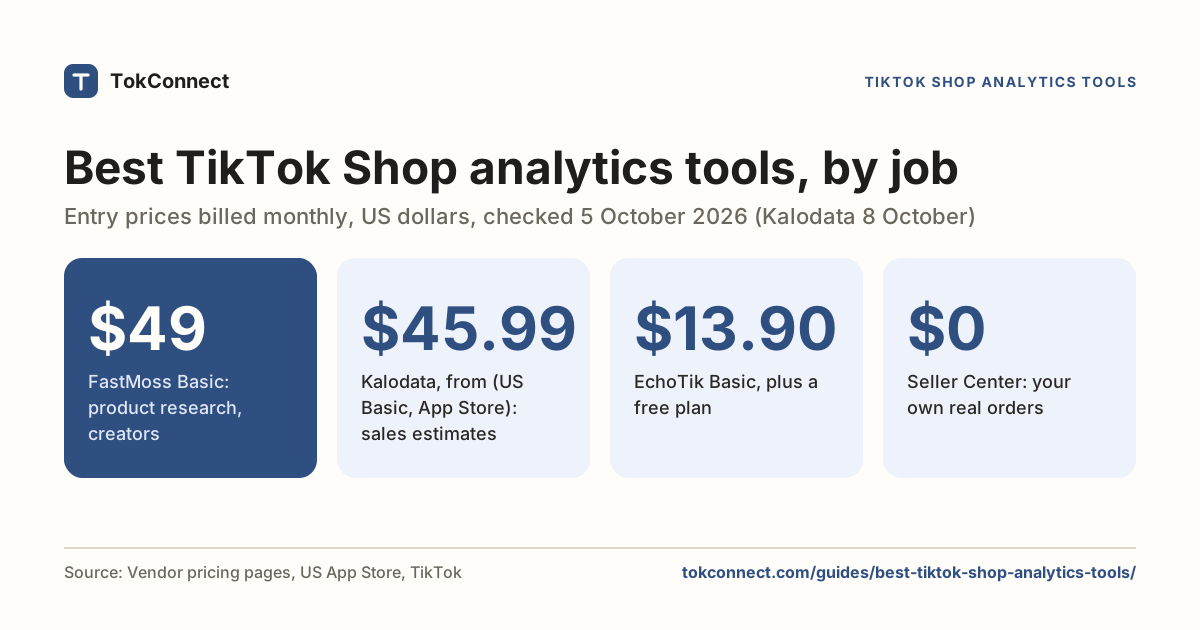
For an agency, the best fit is TokConnect, because one connected AI reports every client and every rival with the same prompt, and nobody needs a login to a client's shop. The dashboard tools show their own screens. Seller Center shows a client's own shop.
| Option | Whose sales it shows | How an agency runs it | Price |
|---|---|---|---|
| TokConnect | Any brand, shop, product or creator in 17 markets (estimates) | One prompt per brand in ChatGPT, Claude, Cursor or n8n; REST API on Pro | 50 free credits, then from $34.99 a month billed yearly; every plan includes MCP |
| Seller Center, Data Compass | The logged-in merchant's own shop: GMV, product clicks and CTOR by content format | One login per client shop | Part of Seller Center |
| Kalodata | Market data for products, shops, creators, videos and LIVE; competitor insight | Web app screens | See kalodata.com |
| FastMoss | Market overview, daily rankings and category panorama | Web app; each plan includes 1 account, extra seats $30 a month on Pro and $70 on Ultimate, billed annually | Annual toggle: Basic $558, Pro $854, Ultimate $1,084 a year |
| Triple Whale | First-party Triple Pixel data from your own stores and ads | Sends enriched conversion data to TikTok for campaign optimisation | See triplewhale.com |
Vendor pages checked 29 October 2026: TikTok Shop Academy (Data Compass guide), kalodata.com, fastmoss.com/pricing (annual toggle, "Anniversary Sale Only" banner) and Triple Whale's help centre. TokConnect from the pricing page. More: the best TikTok Shop analytics tools, Kalodata vs FastMoss and TokConnect for agencies.
How do you rerun the report every month?
You save one prompt and change the brand. TokConnect does the rest: one prompt, seven sections.
- Connect TokConnect once. ChatGPT and Claude connect by sign-in with
https://mcp.tokconnect.com/mcp. Follow the ChatGPT guide or the Claude guide. Cursor and Claude Code use a key from app.tokconnect.com/account; see the Claude Code guide. - Save the one-prompt report. Keep this TokConnect prompt in a ChatGPT project or Claude project, one per client:
Build my monthly TikTok Shop client report for [client brand] on TikTok Shop [market] for the last 30 days: headline revenue and units with growth, the daily trend, video, LIVE and showcase split, affiliates versus own accounts, the top 10 products, the top 10 creators with followers (name brand accounts, mask individuals), the category position, and [rival 1] and [rival 2] side by side.
- Run it on the first working day. Data ends about two days before you ask, so the 30-day window covers the month just gone. TokConnect returns the same seven sections for the new window.
- Automate the loop. In n8n, a schedule trigger and one MCP Client node pointed at TokConnect run the same tools and write to a sheet or Slack: see TokConnect in n8n.
- Scale to many clients. On Pro and Enterprise, TokConnect's REST API at
https://api.tokconnect.com/v1serves the same data with anX-API-Keyheader. The routes for this report areGET /v1/shops/top,GET /v1/shops/{id}/sales,GET /v1/shops/{id}/trend,GET /v1/shops/{id}/productsandGET /v1/shops/{id}/creators. See pricing.
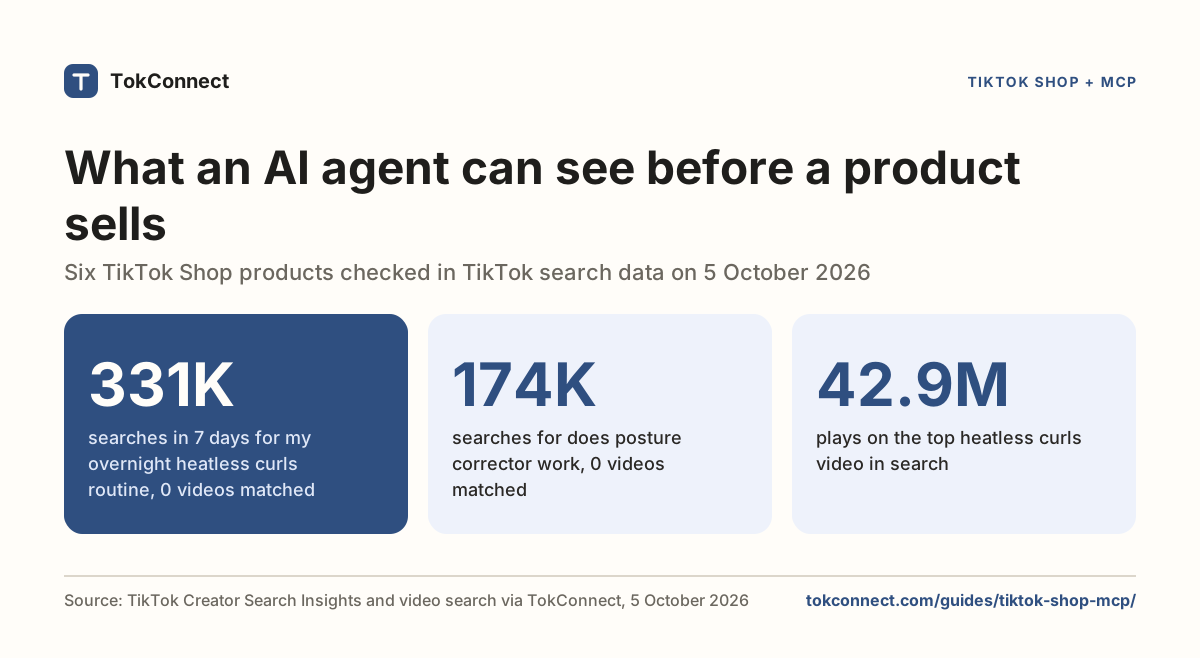
New to TikTok Shop data in an AI? The TikTok Shop MCP guide explains what TokConnect gives ChatGPT, Claude and Cursor.
How we got these numbers
We ran the TokConnect MCP on 29 October 2026 against TikTok Shop US. Shop ranking found each brand and its growth (window 30d): Dolls Kill (seller id 7494963428163095386), Fashion Nova (7495828139121281896) and Comfrt (7495045046260173699). Dolls Kill was picked because it ranked second in the US shop ranking for the six days to 26 October, and first among Womenswear & Underwear shops. Fashion Nova and Comfrt are the other two Womenswear shops in that list. Then shop sales, shop trend, shop products and shop creators for Dolls Kill, shop sales for the two rivals, and category trends for the category.
The window is the 30 days to 26 October 2026, 27 September to 26 October, the last full day of data when we ran it. All figures are TokConnect Shop Analytics estimates: units track TikTok's sold counter and revenue is units times the listed price. Growth compares with the previous 30 days. Category figures cover the last 7 days of data. Weekly sums, shares and the category share are our arithmetic on the returned rows. Individual creators are masked, and creator ids, handles and bios are removed from the published file. Vendor facts come from each vendor's own page, checked 29 October 2026. Data: Dolls Kill client report pulls.
Key statistics
Dolls Kill made an estimated $10.13M from 115.89K units on TikTok Shop US in the 30 days to 26 October 2026, at an average price of $87.40, up 82% on the previous 30 days, according to TokConnect.
Short video made 84.0% of Dolls Kill's estimated TikTok Shop US revenue in the 30 days to 26 October 2026, LIVE 13.1% and showcase 2.9%, according to TokConnect.
Affiliate creators sold 83.9% of Dolls Kill's estimated TikTok Shop US revenue in the 30 days to 26 October 2026 ($8.49M), its own accounts 14.4% and the shopping mall 1.7%, according to TokConnect.
All 6 statistics
Dolls Kill's estimated TikTok Shop US revenue rose from $77,642 on 27 September 2026 to a peak of $742,071 on 9 October 2026, according to TokConnect.
Six Halloween costumes made $2.11M of Dolls Kill's estimated TikTok Shop US revenue in the 30 days to 26 October 2026, 20.8% of the shop, according to TokConnect.
Dolls Kill sold an estimated $3.23M in the 7 days to 26 October 2026, 4.2% of the $77.43M that the Womenswear & Underwear category made on TikTok Shop US, according to TokConnect.
Frequently asked questions
How do I report a TikTok Shop client’s revenue if I have no Seller Center login?
Use TokConnect's shop sales for the brand. It returns estimated revenue, units, average price and the split by video, LIVE, showcase, affiliates and own accounts for any shop in 17 markets. For Dolls Kill it returned an estimated $10.13M from 115.89K units in the 30 days to 26 October 2026.
How often should an agency send a TikTok Shop client report?
Monthly for the headline, weekly for a launch or a season. TokConnect takes a 7, 30, 90, 180 or 365 day window, ending at the last full day of data, about two days before you ask. A saved prompt in ChatGPT or Claude reruns it in minutes.
What should an agency call TikTok Shop sales numbers that are not the client’s own?
Estimates. TokConnect's units track TikTok's sold counter and its revenue is units times the listed price, so a client report should label them estimated revenue. The client's Seller Center holds the booked figure.
Can one TikTok Shop client report cover more than one market?
Yes. TokConnect covers 17 TikTok Shop markets, each in its own currency: the US, UK, Germany, France, Spain, Japan, Thailand, Vietnam, Indonesia, Malaysia, the Philippines, Brazil and Mexico, plus Poland, Italy, the Netherlands and Ireland. Add the market to the prompt.
How do I add competitors to a TikTok Shop client report?
Name two rival shops in the same prompt and ask for the same columns. TokConnect returned Comfrt at $14.34M, Dolls Kill at $10.13M and Fashion Nova at $8.40M for the 30 days to 26 October 2026, with the video, LIVE and affiliate shares for each.
Can an agency automate a TikTok Shop client report?
Yes. In n8n, a schedule trigger and TokConnect's MCP Client node run the same tools and write to a sheet or Slack. On Pro and Enterprise, the REST API returns the same data from routes such as GET /v1/shops/{id}/sales with an X-API-Key header.
Sources and data
- Dolls Kill client report on TikTok Shop US: TokConnect Shop Analytics pulls, 29 October 2026 (snapshot)
- [Feature Guide] Seller Analytics | Product Traffic Analysis (TikTok Shop Academy, seller-us.tiktok.com), checked 29 October 2026
- Kalodata home page (kalodata.com), checked 29 October 2026
- FastMoss pricing (fastmoss.com), checked 29 October 2026
- Triple Whale help centre, Data collection (kb.triplewhale.com), checked 29 October 2026
- TokConnect pricing (tokconnect.com), checked 29 October 2026