What do TikTok Shop shoppers pay in each category?
By DanielUpdated 21 October 2026Data to 19 October 202630 days from 20 SeptemberTikTok Shop US, estimatedHow this is estimated
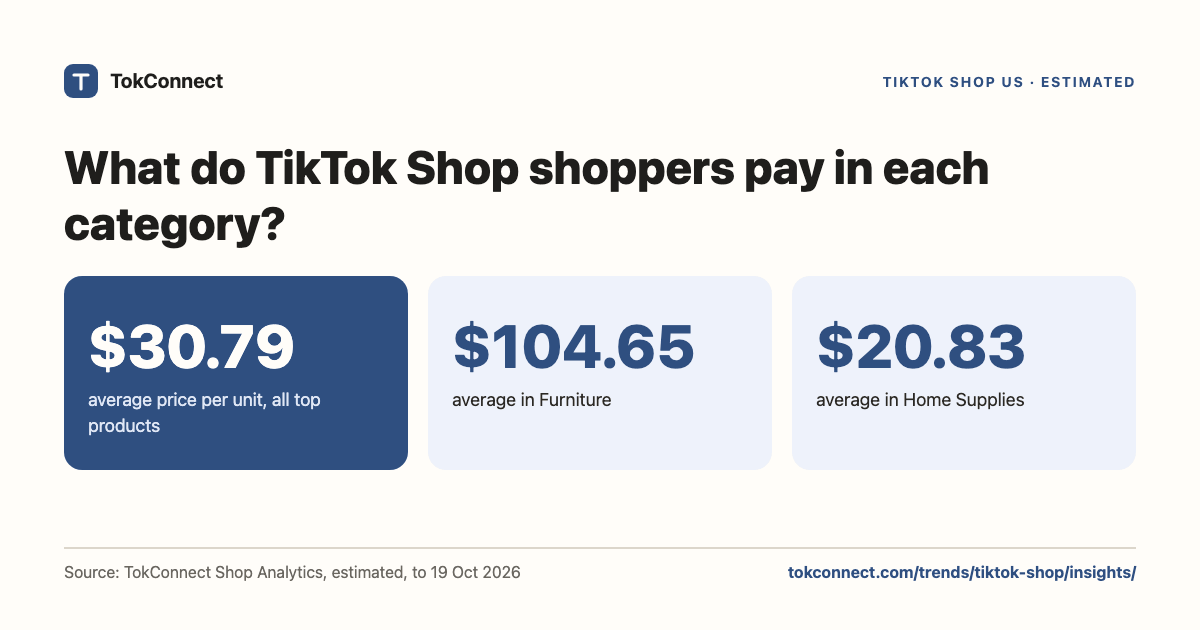
Across 26 categories with 30 or more tracked products, the average price paid per unit runs from $20.83 in Home Supplies to $104.65 in Furniture, against $30.79 for all 10,750 products in the 30 days to 19 October 2026. 12 categories earn most of their revenue from products at $50 or more and none earn most from products under $20.
Key statistics
Free to quote and share with a link to this page. Each figure comes from the data listed under Method and sources.
The average price per unit across 10,750 top TikTok Shop US products is $30.79 (estimated revenue divided by estimated units, 30 days to 19 October 2026).
Furniture has the highest average price per unit, $104.65, among categories with 30 or more tracked products (30 days to 19 October 2026).
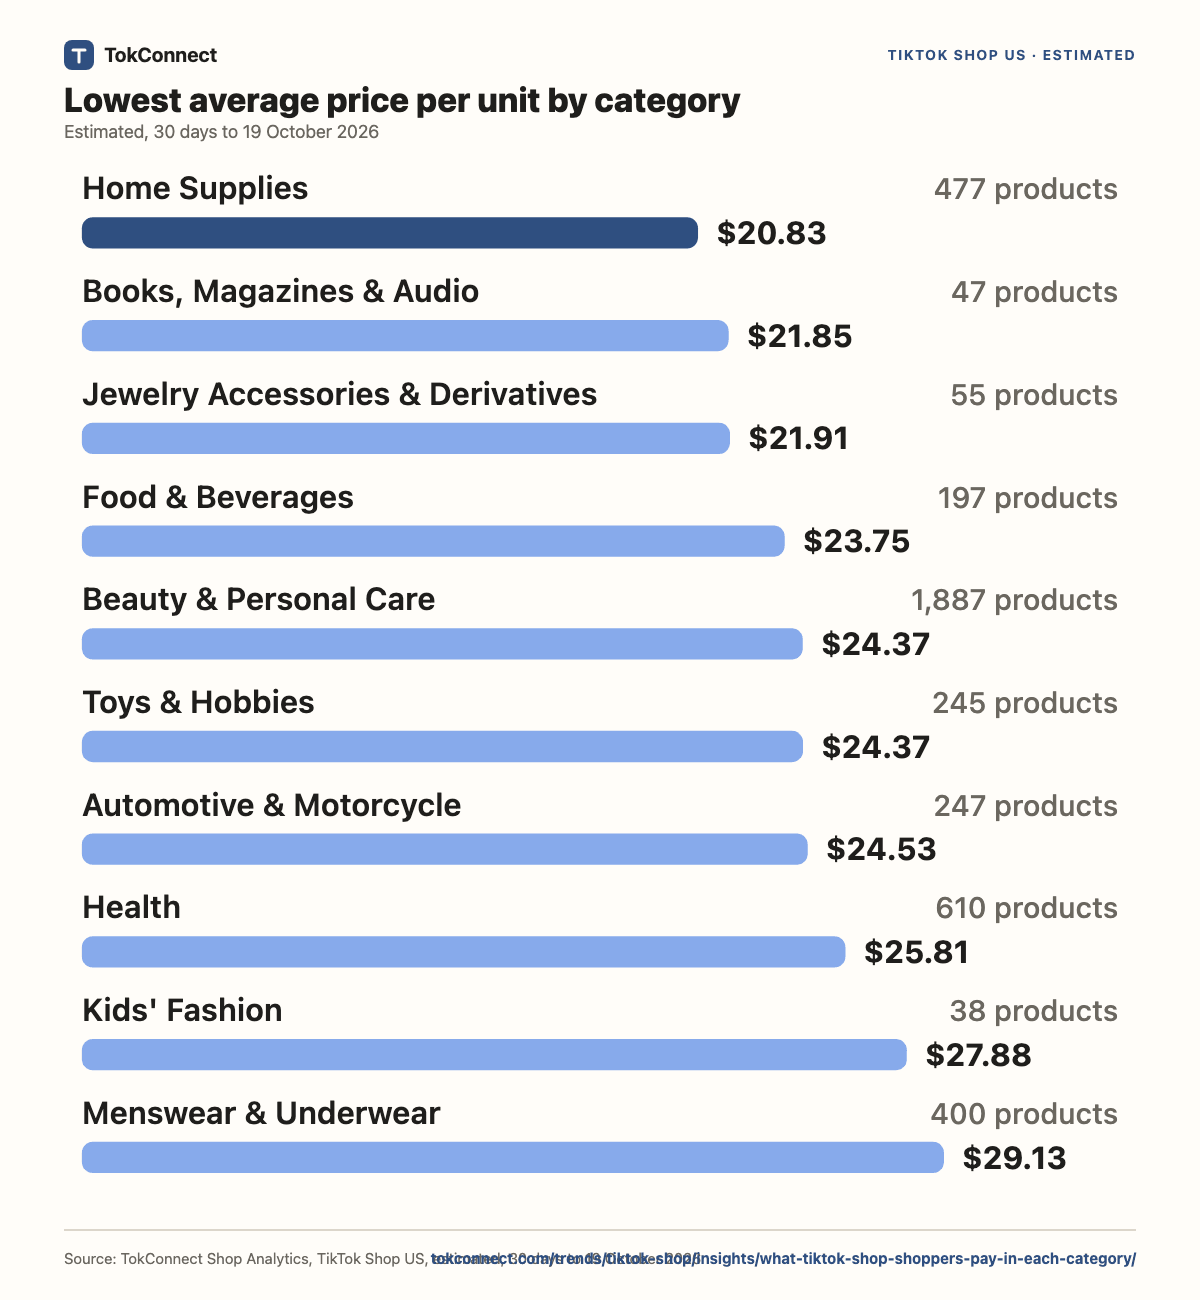
Home Supplies has the lowest, $20.83 per unit (30 days to 19 October 2026).
none of 26 categories earn most of their revenue from products under $20 (30 days to 19 October 2026).
The categories where shoppers pay the most
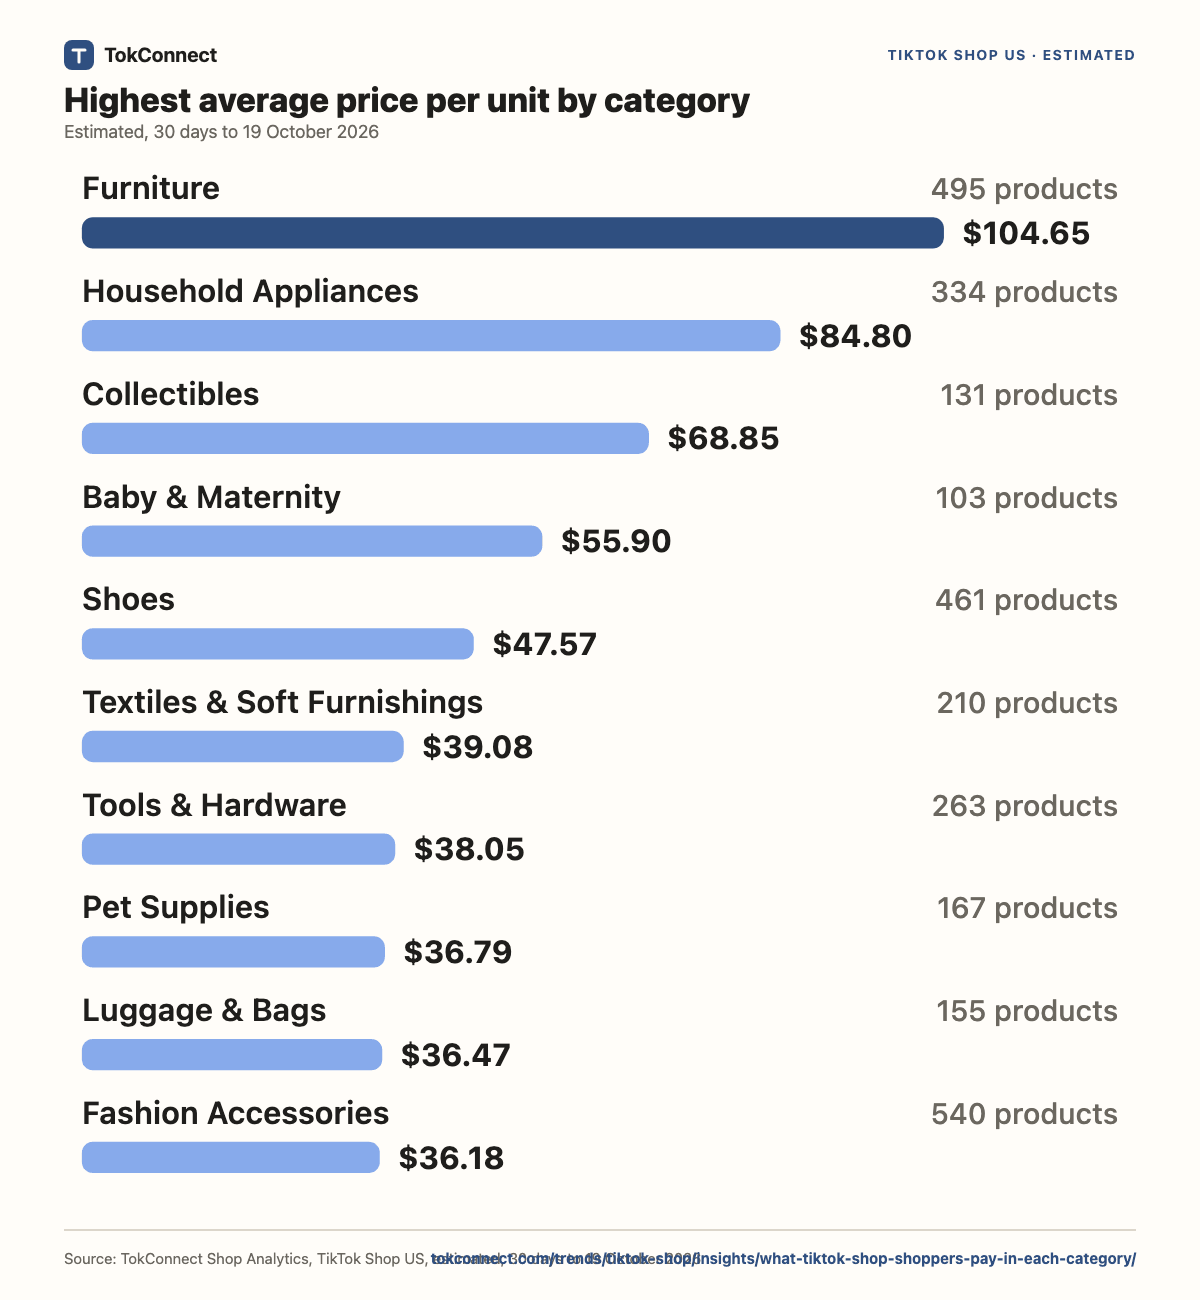
Furniture averages $104.65 per unit and Household Appliances $84.80. The all-category average is $30.79, so the priciest category is 3.4 times the average.
TokConnect Shop Analytics, TikTok Shop US, estimated, 30 days to 19 October 2026
Show the numbers as a table
| Category | Products | Est. revenue | Avg price per unit | Median listed price |
|---|---|---|---|---|
| Furniture | 495 | $32.85M | $104.65 | $149.00 |
| Household Appliances | 334 | $39.60M | $84.80 | $100.72 |
| Collectibles | 131 | $7.01M | $68.85 | $107.15 |
| Baby & Maternity | 103 | $7.33M | $55.90 | $69.00 |
| Shoes | 461 | $34.82M | $47.57 | $54.00 |
| Textiles & Soft Furnishings | 210 | $24.01M | $39.08 | $37.85 |
| Tools & Hardware | 263 | $19.55M | $38.05 | $54.32 |
| Pet Supplies | 167 | $11.02M | $36.79 | $39.00 |
| Luggage & Bags | 155 | $9.51M | $36.47 | $44.00 |
| Fashion Accessories | 540 | $34.63M | $36.18 | $56.00 |
| Home Improvement | 264 | $18.89M | $36.13 | $44.00 |
| Phones & Electronics | 569 | $47.44M | $35.17 | $41.26 |
| Sports & Outdoor | 687 | $56.89M | $34.43 | $41.00 |
| Computers & Office Equipment | 151 | $10.60M | $33.87 | $41.81 |
| Kitchenware | 187 | $12.69M | $31.12 | $34.00 |
| Womenswear & Underwear | 1,830 | $148.88M | $29.73 | $31.00 |
| Menswear & Underwear | 400 | $26.61M | $29.13 | $32.23 |
| Kids' Fashion | 38 | $2.05M | $27.88 | $28.02 |
| Health | 610 | $57.78M | $25.81 | $29.00 |
| Automotive & Motorcycle | 247 | $19.09M | $24.53 | $30.00 |
| Toys & Hobbies | 245 | $15.69M | $24.37 | $29.00 |
| Beauty & Personal Care | 1,887 | $196.90M | $24.37 | $26.58 |
| Food & Beverages | 197 | $14.08M | $23.75 | $26.00 |
| Jewelry Accessories & Derivatives | 55 | $2.60M | $21.91 | $18.00 |
| Books, Magazines & Audio | 47 | $3.08M | $21.85 | $27.00 |
| Home Supplies | 477 | $32.16M | $20.83 | $24.00 |
Go deeper in TokConnectShow the average and median price of the best-selling TikTok Shop US products in [my category] over the last 30 days, and which price bands earn most revenue there.
The categories that run on low prices
Home Supplies averages $20.83 per unit and Books, Magazines & Audio $21.85. In these categories a seller needs volume: the margin per sale is small before commission and fees.
TokConnect Shop Analytics, TikTok Shop US, estimated, 30 days to 19 October 2026
Show the numbers as a table
| Category | Products | Avg price per unit | Revenue from products under $20 |
|---|---|---|---|
| Home Supplies | 477 | $20.83 | 36.7% |
| Books, Magazines & Audio | 47 | $21.85 | 26.6% |
| Jewelry Accessories & Derivatives | 55 | $21.91 | 43.9% |
| Food & Beverages | 197 | $23.75 | 18.1% |
| Beauty & Personal Care | 1,887 | $24.37 | 30.0% |
| Toys & Hobbies | 245 | $24.37 | 31.9% |
| Automotive & Motorcycle | 247 | $24.53 | 29.2% |
| Health | 610 | $25.81 | 24.0% |
| Kids' Fashion | 38 | $27.88 | 12.8% |
| Menswear & Underwear | 400 | $29.13 | 14.1% |
| Womenswear & Underwear | 1,830 | $29.73 | 14.0% |
| Kitchenware | 187 | $31.12 | 16.1% |
| Computers & Office Equipment | 151 | $33.87 | 22.1% |
| Sports & Outdoor | 687 | $34.43 | 14.3% |
| Phones & Electronics | 569 | $35.17 | 20.0% |
| Home Improvement | 264 | $36.13 | 20.7% |
| Fashion Accessories | 540 | $36.18 | 15.8% |
| Luggage & Bags | 155 | $36.47 | 10.4% |
| Pet Supplies | 167 | $36.79 | 21.7% |
| Tools & Hardware | 263 | $38.05 | 13.1% |
| Textiles & Soft Furnishings | 210 | $39.08 | 9.9% |
| Shoes | 461 | $47.57 | 3.8% |
| Baby & Maternity | 103 | $55.90 | 10.5% |
| Collectibles | 131 | $68.85 | 6.0% |
| Household Appliances | 334 | $84.80 | 1.7% |
| Furniture | 495 | $104.65 | 0.3% |
Premium against budget inside the biggest categories
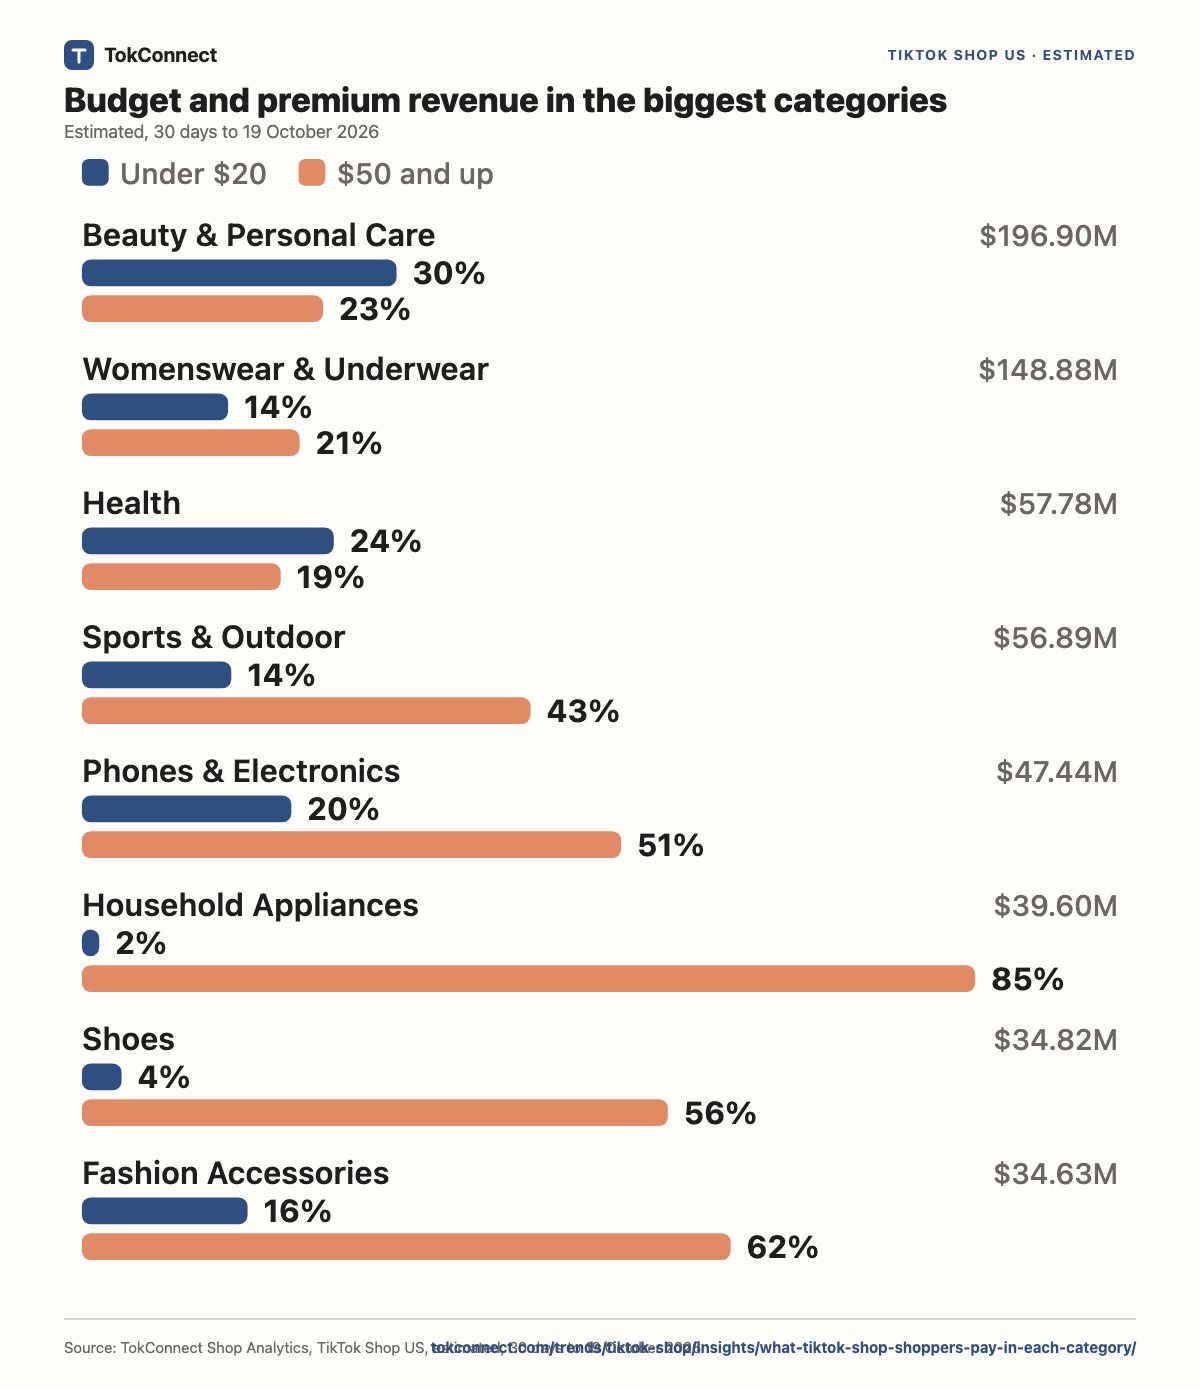
Among the 8 biggest categories by revenue, the one with the largest premium share is Household Appliances (85% of revenue from products at $50 or more); the one with the largest budget share is Beauty & Personal Care (30% from products under $20).
TokConnect Shop Analytics, TikTok Shop US, estimated, 30 days to 19 October 2026
Show the numbers as a table
| Category | Est. revenue | From products under $20 | From products $50 and up |
|---|---|---|---|
| Beauty & Personal Care | $196.90M | 30.0% | 23.0% |
| Womenswear & Underwear | $148.88M | 14.0% | 20.8% |
| Health | $57.78M | 24.0% | 19.0% |
| Sports & Outdoor | $56.89M | 14.3% | 42.8% |
| Phones & Electronics | $47.44M | 20.0% | 51.5% |
| Household Appliances | $39.60M | 1.7% | 85.2% |
| Shoes | $34.82M | 3.8% | 55.9% |
| Fashion Accessories | $34.63M | 15.8% | 61.9% |
What this means
For sellers
Price against your own category, not against the whole shop. The average unit in Furniture costs $104.65 and in Home Supplies $20.83; a price that looks high in one is ordinary in the other.
For affiliates
Pick categories where the price lets a short video pay: a unit in Furniture costs 5.0 times a unit in Home Supplies before commission.
For brands
12 categories earn most of their money from products at $50 or more. If you are launching into one of them, compare your price with your category's average first; averages run from $20.83 to $104.65 per unit.
What TokConnect adds to this study
This page is one snapshot of one question. TokConnect runs the same Shop Analytics live, for your own niche, brand or product, down to the creator, the video and the LIVE.
- Prices in a subcategoryFor the TikTok Shop US subcategory [subcategory], show the price spread of the top 50 products and what the best sellers cost.Ask in TokConnect
- Cheap and premium winnersWhich TikTok Shop US categories have the biggest gap between budget and premium best sellers this month?Ask in TokConnect
- Your price versus peersI sell a product at [price] in [category]. Show how many tracked TikTok Shop US best sellers cost less and what the ones at my price earn.Ask in TokConnect
- Price and changeIn [my category] on TikTok Shop US, did cheaper or pricier products change more in revenue over the last 7 days against the 7 before, next to the category's overall change?Ask in TokConnect
50 free credits, no card, failed calls are free. Works in , , and TokConnect Chat. Try the free TikTok Shop analytics tool or read the TikTok Shop MCP guide.
Questions about this study
What is the average price on TikTok Shop?
$30.79 per unit across 10,750 top products, estimated revenue divided by estimated units for the 30 days to 19 October 2026. It varies from $20.83 to $104.65 by category.
Which TikTok Shop category has the highest prices?
Furniture, at $104.65 per unit, among categories with 30 or more tracked products.
Which TikTok Shop category is cheapest?
Home Supplies, at $20.83 per unit.
How many categories sell mostly premium products?
12 of 26 earn most of their revenue from products at $50 or more.
Is the average price the same as the median price?
No. The average here is revenue divided by units, so it follows what shoppers actually bought. The table also shows the median listed price of the tracked products in each category.
Method and sources
Estimated from TikTok Shop sold counts and listed prices, 30 days to 19 October 2026. The product pool holds 10,764 TikTok Shop US products with at least $25K of estimated revenue in 30 days, gathered with subcategory names, level-3 names and 108 keywords. Products the source flags as price-suspect are dropped, and their revenue is in no figure here. A category needs 30 or more products with a listed price and units to appear. Totals are sums over these tracked products, not the size of the market. Pulled 21 October 2026, data to 19 October 2026. Read the full method and corrections policy. Questions or corrections: dj@tokconnect.com.