How much does a TikTok Shop brand's revenue change from week to week?
By DanielUpdated 21 October 2026Data to 19 October 202630 days from 20 SeptemberTikTok Shop US, estimatedHow this is estimated
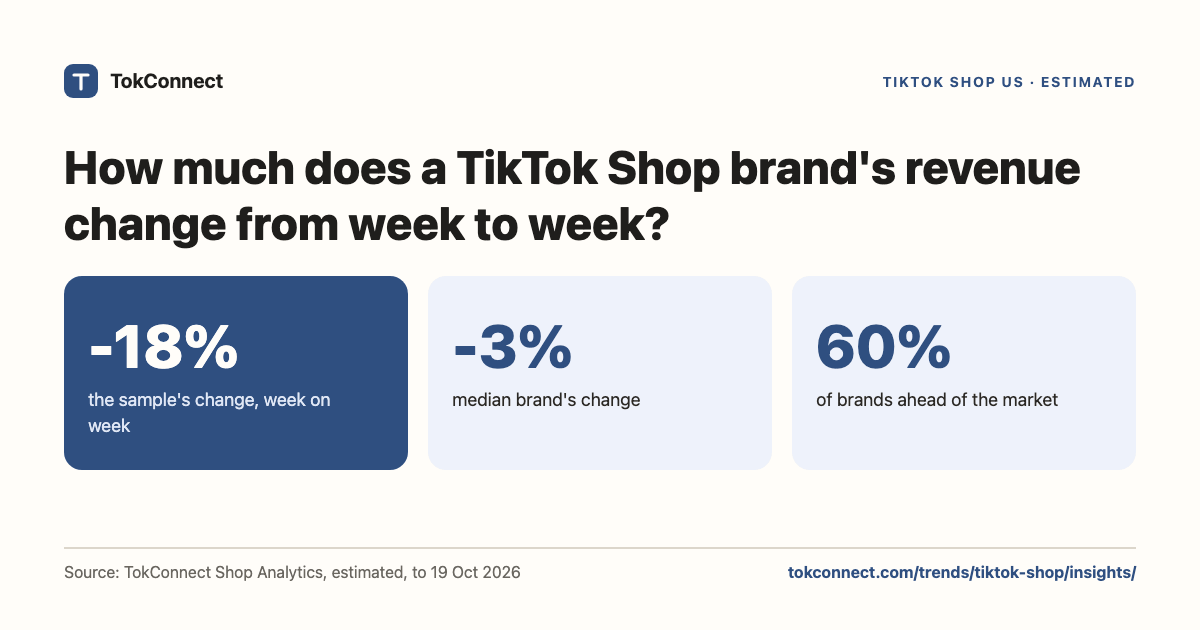
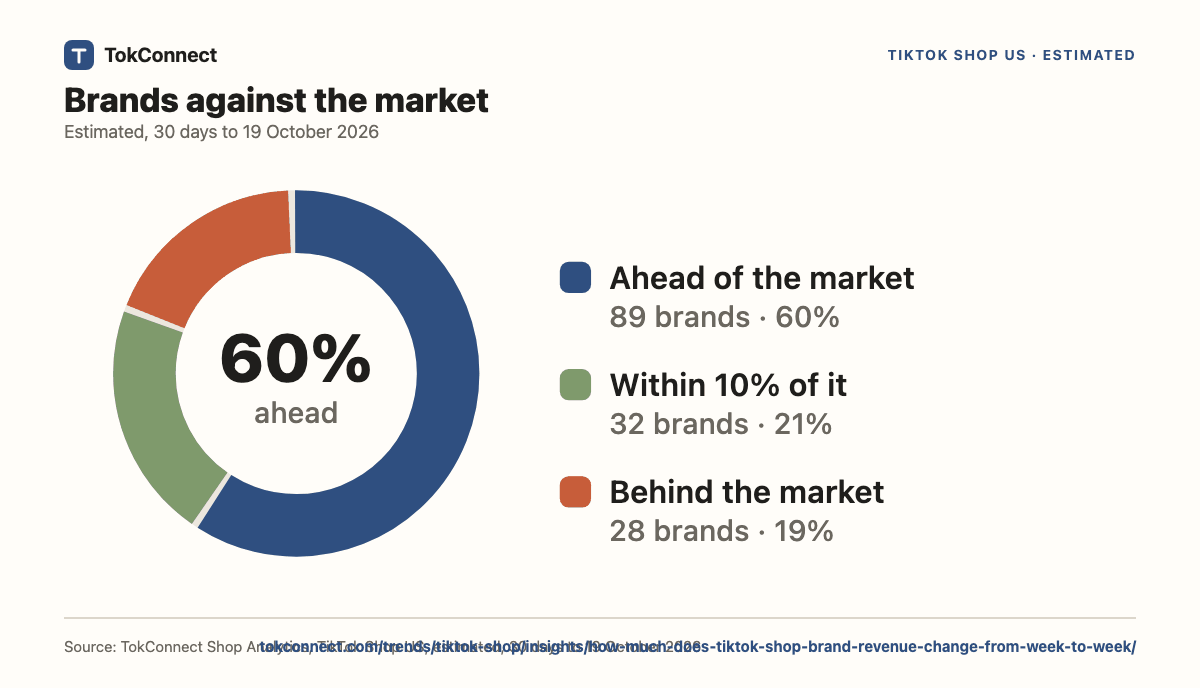
Across a sample of 149 TikTok Shop US brands, daily revenue in the 7 days to 19 October 2026 changed -17.7% for the sample as a whole against the 7 days before, and -3.4% for the median brand (estimated). Measured against that market change, 60% of brands were ahead by 10% or more, 19% were behind by 10% or more, and 21% were within 10% of it.
Key statistics
Free to quote and share with a link to this page. Each figure comes from the data listed under Method and sources.
Revenue for a sample of 149 TikTok Shop US brands changed -17.7% in the 7 days to 19 October 2026 against the 7 days before (estimated, usable days only).
The median sampled brand changed -3.4% over the same two weeks, against -17.7% for the sample as a whole.
59.7% of sampled brands changed by 10% or more above the market's -17.7%; 18.8% were 10% or more below it (7 days to 19 October 2026).
21.5% of sampled brands moved within 10% of the market (7 days to 19 October 2026).
The median change was -1.4% for brands earning Under $500K and -19.1% for brands earning $2M or more, against -17.7% for the market (7 days to 19 October 2026).
Brand changes are wide around the market's
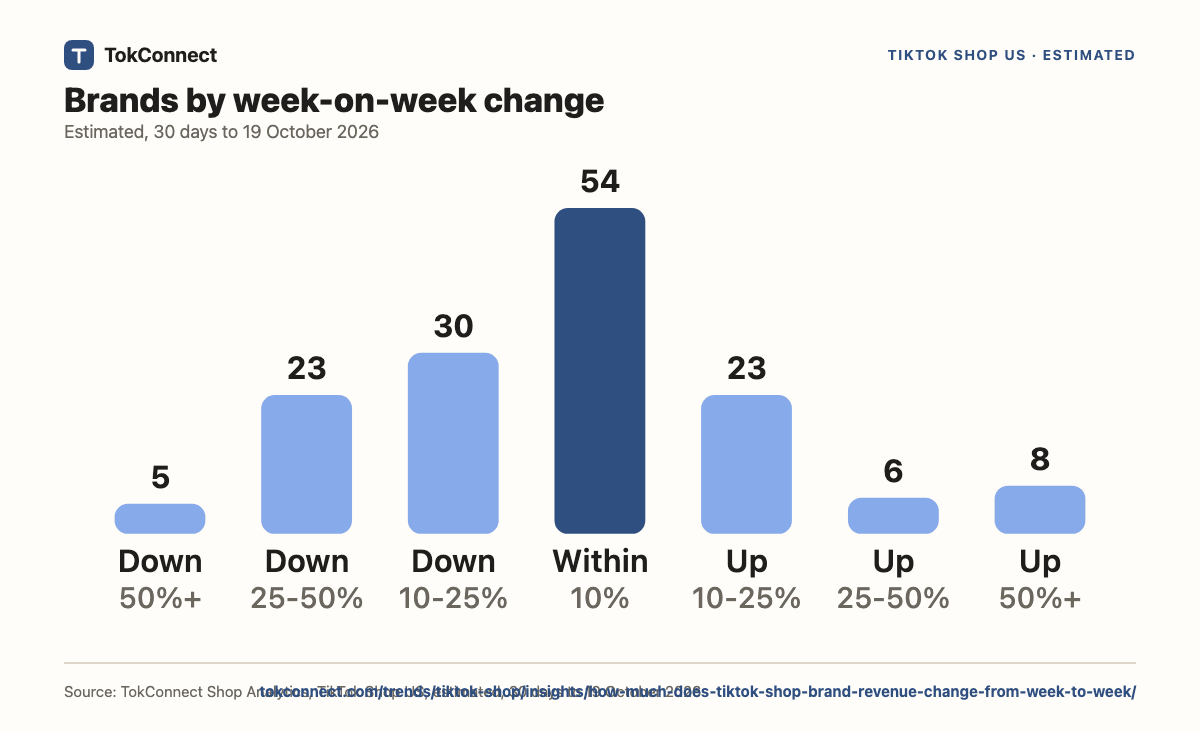
The market moved -17.7%. The most common brand outcome was within 10% (54 brands); 58 brands were down 10% or more and 37 were up 10% or more, so one week says little about a single brand.
TokConnect Shop Analytics, TikTok Shop US, estimated, 30 days to 19 October 2026
Show the numbers as a table
| Change in 7 days | Brands |
|---|---|
| Down 50%+ | 5 |
| Down 25% to 50% | 23 |
| Down 10% to 25% | 30 |
| Within 10% | 54 |
| Up 10% to 25% | 23 |
| Up 25% to 50% | 6 |
| Up 50%+ | 8 |
| Sample as a whole (market) | -17.7% |
Go deeper in TokConnectFor the TikTok Shop US brand [brand], show its revenue change in the last 7 days against the 7 days before, next to the market's change for the same weeks, and which products and creators drove it.
Against the market, not on their own
Against the market's -17.7%, 89 brands were ahead by 10% or more, 32 within 10% and 28 behind by 10% or more.
TokConnect Shop Analytics, TikTok Shop US, estimated, 30 days to 19 October 2026
Show the numbers as a table
| Against the market | Brands | Share |
|---|---|---|
| Ahead by 10% or more | 89 | 59.7% |
| Within 10% | 32 | 21.5% |
| Behind by 10% or more | 28 | 18.8% |
How brand size lines up against the market
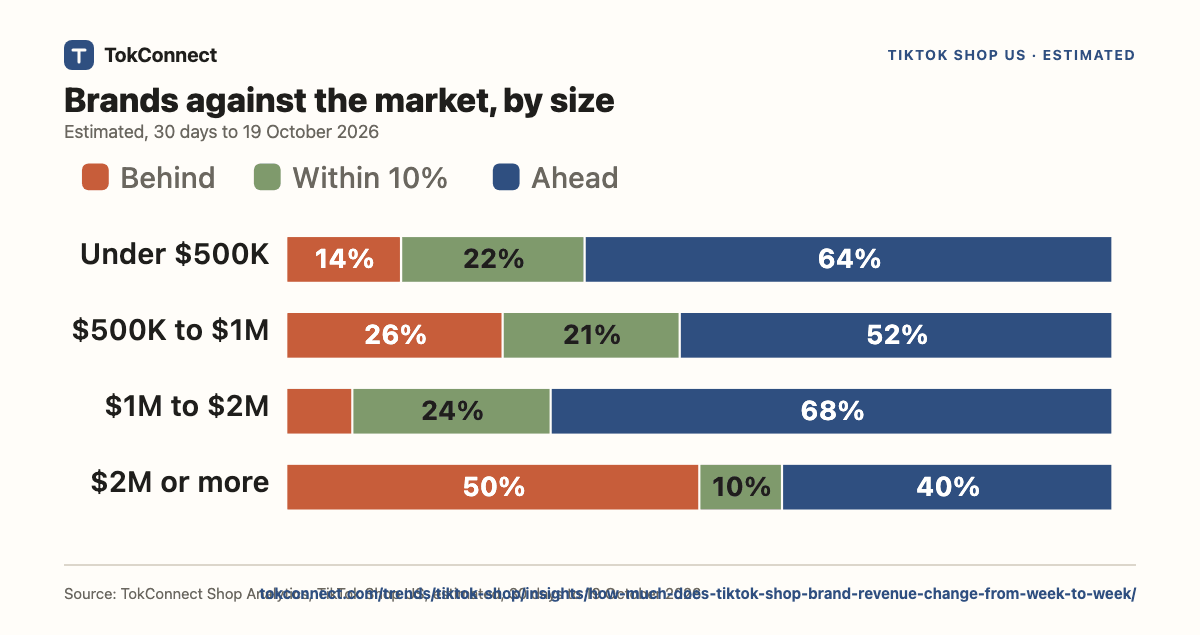
The median change was -1.4% for brands earning Under $500K and -19.1% for brands earning $2M or more; the market changed -17.7%. 64% of the smaller brands were ahead of the market, against 40% of the larger ones.
TokConnect Shop Analytics, TikTok Shop US, estimated, 30 days to 19 October 2026
Show the numbers as a table
| 30-day revenue | Brands | Median change | Behind the market | Within 10% | Ahead of the market |
|---|---|---|---|---|---|
| Under $500K | 72 | -1.4% | 13.9% | 22.2% | 63.9% |
| $500K to $1M | 42 | -7.5% | 26.2% | 21.4% | 52.4% |
| $1M to $2M | 25 | +0.6% | 8.0% | 24.0% | 68.0% |
| $2M or more | 10 | -19.1% | 50.0% | 10.0% | 40.0% |
What this means
For brands
Put your own week next to the market's -17.7% before you read it. A brand that changed -18% moved with the market; 79% of sampled brands were 10% or more away from it in one direction or the other.
For affiliates
Look for brands that are ahead of the market, not only up: 89 of 149 sampled brands changed 10% or more above the market's -17.7%, which is a quicker list to check than every brand that rose.
For sellers
The median brand changed -3.4% against -17.7% for the market. Judge a slow week against the market first, then against your own two or three weeks before it.
What TokConnect adds to this study
This page is one snapshot of one question. TokConnect runs the same Shop Analytics live, for your own niche, brand or product, down to the creator, the video and the LIVE.
- Your brand against the marketFor [brand] on TikTok Shop US, show daily revenue for 30 days and its last-7-day change against the median brand in its category.Ask in TokConnect
- Brands ahead of their categoryList TikTok Shop US brands in [my category] whose revenue in the last 7 days beat their category's change by more than 10%, with 30-day revenue.Ask in TokConnect
- Why a brand movedFor [brand] on TikTok Shop US, which products, creators and videos drove the last 7 days against the 7 before?Ask in TokConnect
- Watch a listTrack [brand 1], [brand 2] and [brand 3] on TikTok Shop US and show each one's week-on-week change next to the market's.Ask in TokConnect
50 free credits, no card, failed calls are free. Works in , , and TokConnect Chat. Try the free TikTok Shop analytics tool or read the TikTok Shop MCP guide.
Questions about this study
How much does a TikTok Shop brand's revenue change from week to week?
The median sampled brand changed -3.4% in the 7 days to 19 October 2026 against the 7 days before, while the sample as a whole changed -17.7% (estimated).
How do brands compare with the market week to week?
59.7% were ahead of the market by 10% or more, 21.5% within 10%, 18.8% behind by 10% or more.
Do bigger brands move differently from smaller ones?
The median change is -1.4% for brands earning Under $500K and -19.1% for $2M or more, against -17.7% for the market.
How is the week-on-week change measured?
From each brand's daily estimated revenue: revenue per usable day in the last 7 days against the 7 days before. We do not use the source's list growth figure, which uses a different window.
How many brands are in the change sample?
150 brand shops drawn at random, with a fixed seed, from the shop pool; 149 had at least 4 usable days in each week and $10K or more in the earlier week, and are counted.
Method and sources
Estimated from TikTok Shop sold counts and listed prices, 30 days to 19 October 2026. This study uses a sample: 150 brand shops drawn at random, with a fixed seed, from the shop pool (brands with $250K or more of estimated 30-day revenue). Each change is computed from the brand's own daily estimated revenue (revenue per usable day, last 7 days against the 7 before), never from the source's list growth figure. A market index (each day's revenue divided by the brand's median day, then the median across brands) finds days when most brands read far below normal because of a gap in the source: days with an index under 0.6 are left out. No day fell under 0.6 in this window. A brand needs 4 usable days in each week and at least $10K of revenue in the earlier week; 0 brands fell under that and are not counted, leaving 149. Displayed changes are capped at +500%. The market change is the sample as a whole, not every shop. Pulled 21 October 2026, data to 19 October 2026. Read the full method and corrections policy. Questions or corrections: dj@tokconnect.com.