How much do TikTok Shop brands depend on one product?
By DanielUpdated 21 October 2026Data to 19 October 202630 days from 20 SeptemberTikTok Shop US, estimatedHow this is estimated
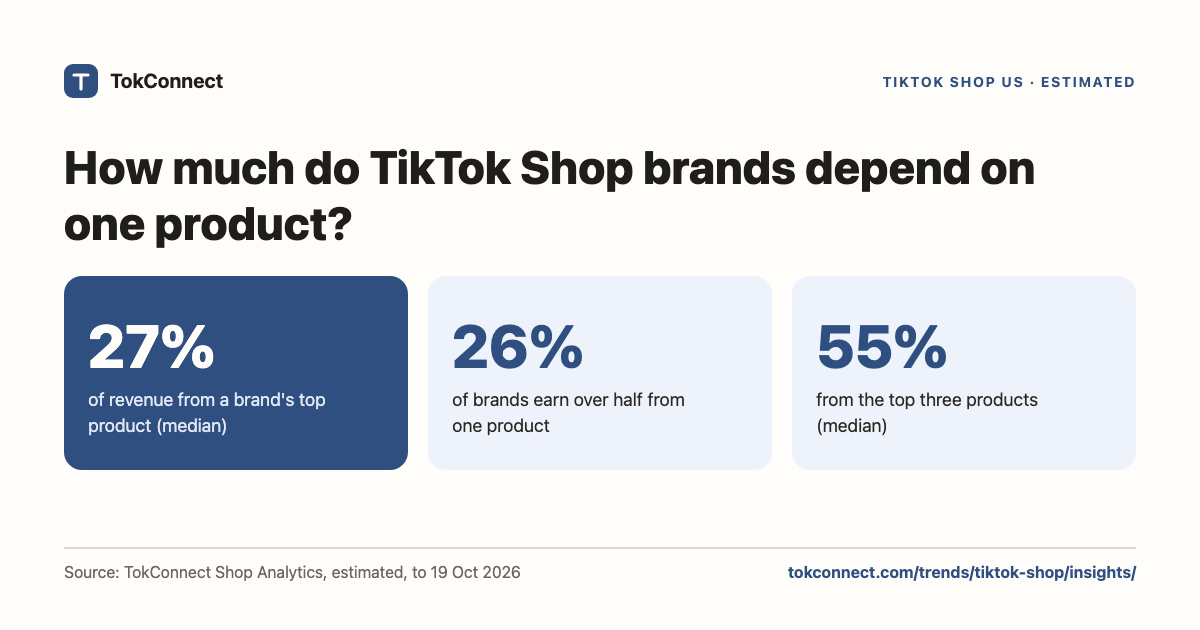
The median TikTok Shop US brand in a sample of 149 earns 26.6% of its estimated 30-day revenue from its single best-selling product (30 days to 19 October 2026). 44% of brands earn more than 30% from one product and 26% earn more than half, while the best three products together make a median 55%.
Key statistics
Free to quote and share with a link to this page. Each figure comes from the data listed under Method and sources.
The median brand in a sample of 149 TikTok Shop US brands earns 26.6% of its revenue from its top product (30 days to 19 October 2026).
25.5% of sampled brands earn more than half of their revenue from one product; 12 earn more than 80% (30 days to 19 October 2026).
The top three products make a median 55.3% of a sampled brand's revenue (30 days to 19 October 2026).
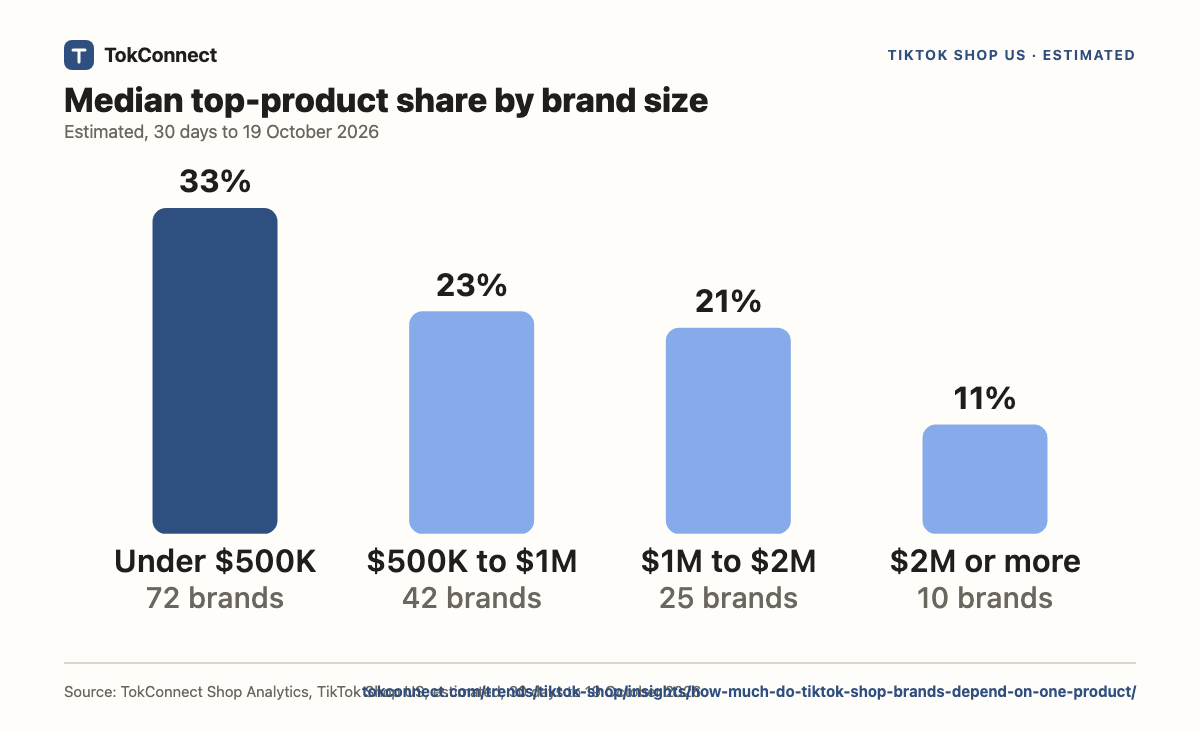
The median top-product share is 33% for brands earning Under $500K and 11% for brands earning $2M or more (30 days to 19 October 2026).
The sample is 149 brand shops drawn at random from the shop pool; 0 were left out because their product rows exceeded their shop total.
How much one product carries
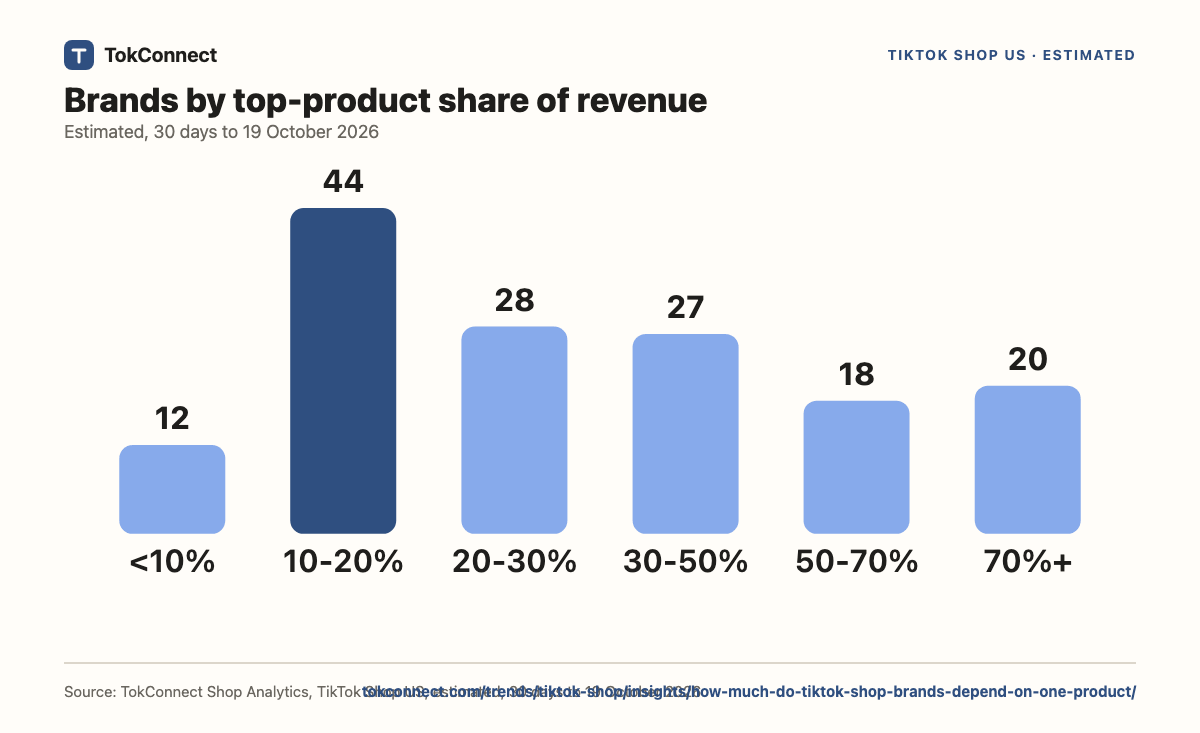
The most common range is 10% to 20% (44 brands). 65 brands earn 30% or more from one product and 38 earn half or more.
TokConnect Shop Analytics, TikTok Shop US, estimated, 30 days to 19 October 2026
Show the numbers as a table
| Top product share of revenue | Brands |
|---|---|
| Under 10% | 12 |
| 10% to 20% | 44 |
| 20% to 30% | 28 |
| 30% to 50% | 27 |
| 50% to 70% | 18 |
| 70% or more | 20 |
Go deeper in TokConnectFor TikTok Shop US brand [brand], show how much of its 30-day revenue comes from its top product, top 3 and top 10, and the creators behind the top one.
Bigger brands lean on one product less
Brands earning Under $500K get a median 33% from their top product; brands earning $2M or more get 11%.
TokConnect Shop Analytics, TikTok Shop US, estimated, 30 days to 19 October 2026
Show the numbers as a table
| 30-day revenue | Brands | Median top-product share | Brands above 50% |
|---|---|---|---|
| Under $500K | 72 | 33.0% | 33.3% |
| $500K to $1M | 42 | 22.5% | 21.4% |
| $1M to $2M | 25 | 20.9% | 20.0% |
| $2M or more | 10 | 11.1% | 0.0% |
The typical brand's product mix
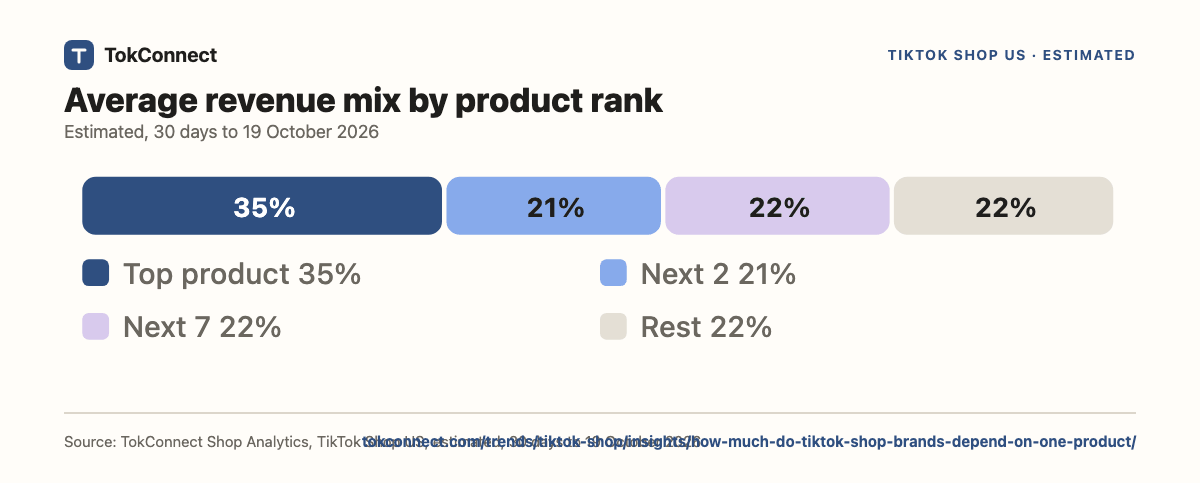
Averaged across the sample, the best product makes 35% of revenue, products 2 and 3 make 21%, products 4 to 10 make 22% and every other product makes 22%.
TokConnect Shop Analytics, TikTok Shop US, estimated, 30 days to 19 October 2026
Show the numbers as a table
| Product rank | Average share of revenue |
|---|---|
| Top product | 35.2% |
| Products 2 and 3 | 21.2% |
| Products 4 to 10 | 22.1% |
| All other | 21.6% |
What this means
For brands
One hit product is normal: the median brand makes 27% from it, and 44% make over 30%. If yours is above that, a second product is the best protection against one listing being pulled, copied or run out of stock.
For affiliates
Look past the hero product. It carries a median 27% of a brand's sales, and the next two products make a median 29% between them, so a brand usually has more than one product worth pitching.
For sellers
If your top product is above 50% of revenue you are in the 26% of sampled brands that depend on one listing. Track its daily revenue, not only the shop total.
What TokConnect adds to this study
This page is one snapshot of one question. TokConnect runs the same Shop Analytics live, for your own niche, brand or product, down to the creator, the video and the LIVE.
- Check a competitorFor [competitor] on TikTok Shop US, show the share of revenue from its top product, top 3 and top 10 over the last 30 days.Ask in TokConnect
- Hero products in your nicheWhich TikTok Shop US brands in [my category] earn over 50% of revenue from one product, and what is that product?Ask in TokConnect
- Diversified brandsFind TikTok Shop US brands in [my category] with at least 10 products earning $10K or more in the last 30 days.Ask in TokConnect
- Hero product watchShow the daily revenue of the top product of [brand] on TikTok Shop US over the last 30 days and the creators driving it.Ask in TokConnect
50 free credits, no card, failed calls are free. Works in , , and TokConnect Chat. Try the free TikTok Shop analytics tool or read the TikTok Shop MCP guide.
Questions about this study
How much do TikTok Shop brands depend on one product?
The median sampled brand earns 26.6% of its revenue from its top product, and 25.5% of brands earn more than half from one (30 days to 19 October 2026).
Do bigger brands rely less on a hero product?
Slightly: the median is 33% for brands earning Under $500K and 11% for $2M or more.
How many products make most of a brand's revenue?
The top three make a median 55%.
How were the brands in this sample chosen?
149 brand shops drawn at random, with a fixed seed, from the shop pool of brands with $250K or more of estimated 30-day revenue. The same method is repeated each month.
Are these numbers exact?
No. Product revenue is the source's estimate from sold counts and listed prices. A brand is left out when its product rows add up to more than its shop total, a sign of a placeholder price, because the shop product rows carry no price flag of their own.
Method and sources
Estimated from TikTok Shop sold counts and listed prices, 30 days to 19 October 2026. This study uses a sample: 150 brand shops drawn at random, with a fixed seed, from the shop pool (brands with $250K or more of estimated 30-day revenue). For each, the source gave its 30-day revenue and the revenue of its top products; both come from the same estimate, so any gap in the source day by day affects shop and product alike. 0 shops are left out because their product rows add up to more than their shop total, and 1 because no product rows came back; 149 remain. Only the top 100 products come back for each shop, which is enough to measure the top three and the top ten. Pulled 21 October 2026, data to 19 October 2026. A sample of 149 brands says more about the typical brand than about any one. Read the full method and corrections policy. Questions or corrections: dj@tokconnect.com.