How much do the top three brands take in each TikTok Shop category?
By DanielUpdated 21 October 2026Data to 19 October 202630 days from 20 SeptemberTikTok Shop US, estimatedHow this is estimated
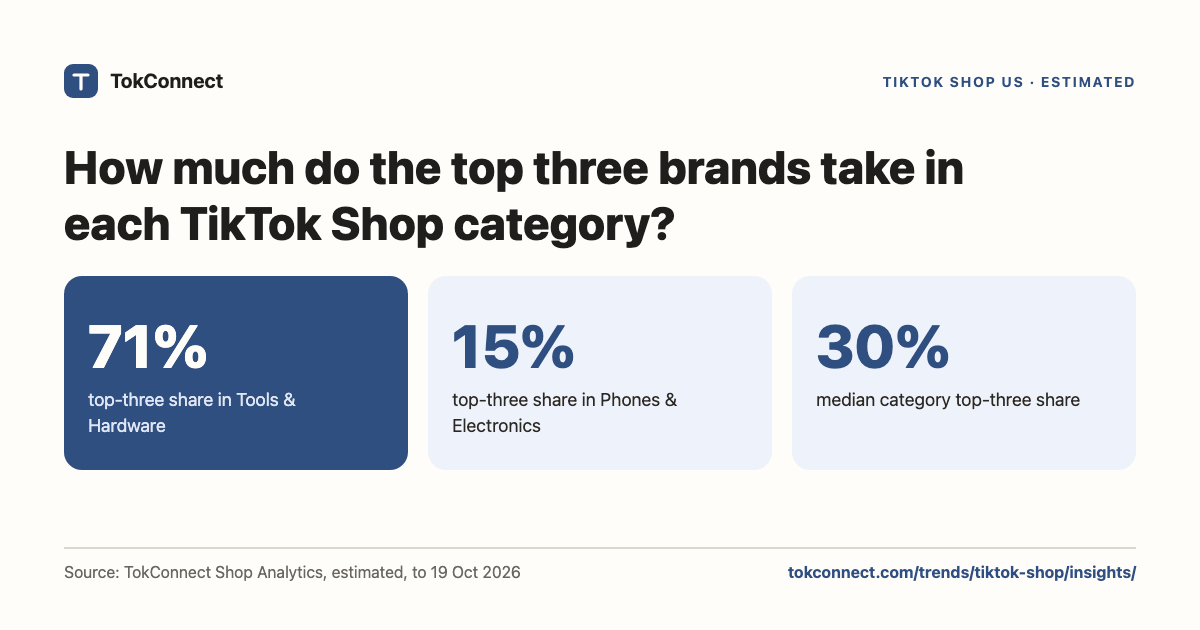
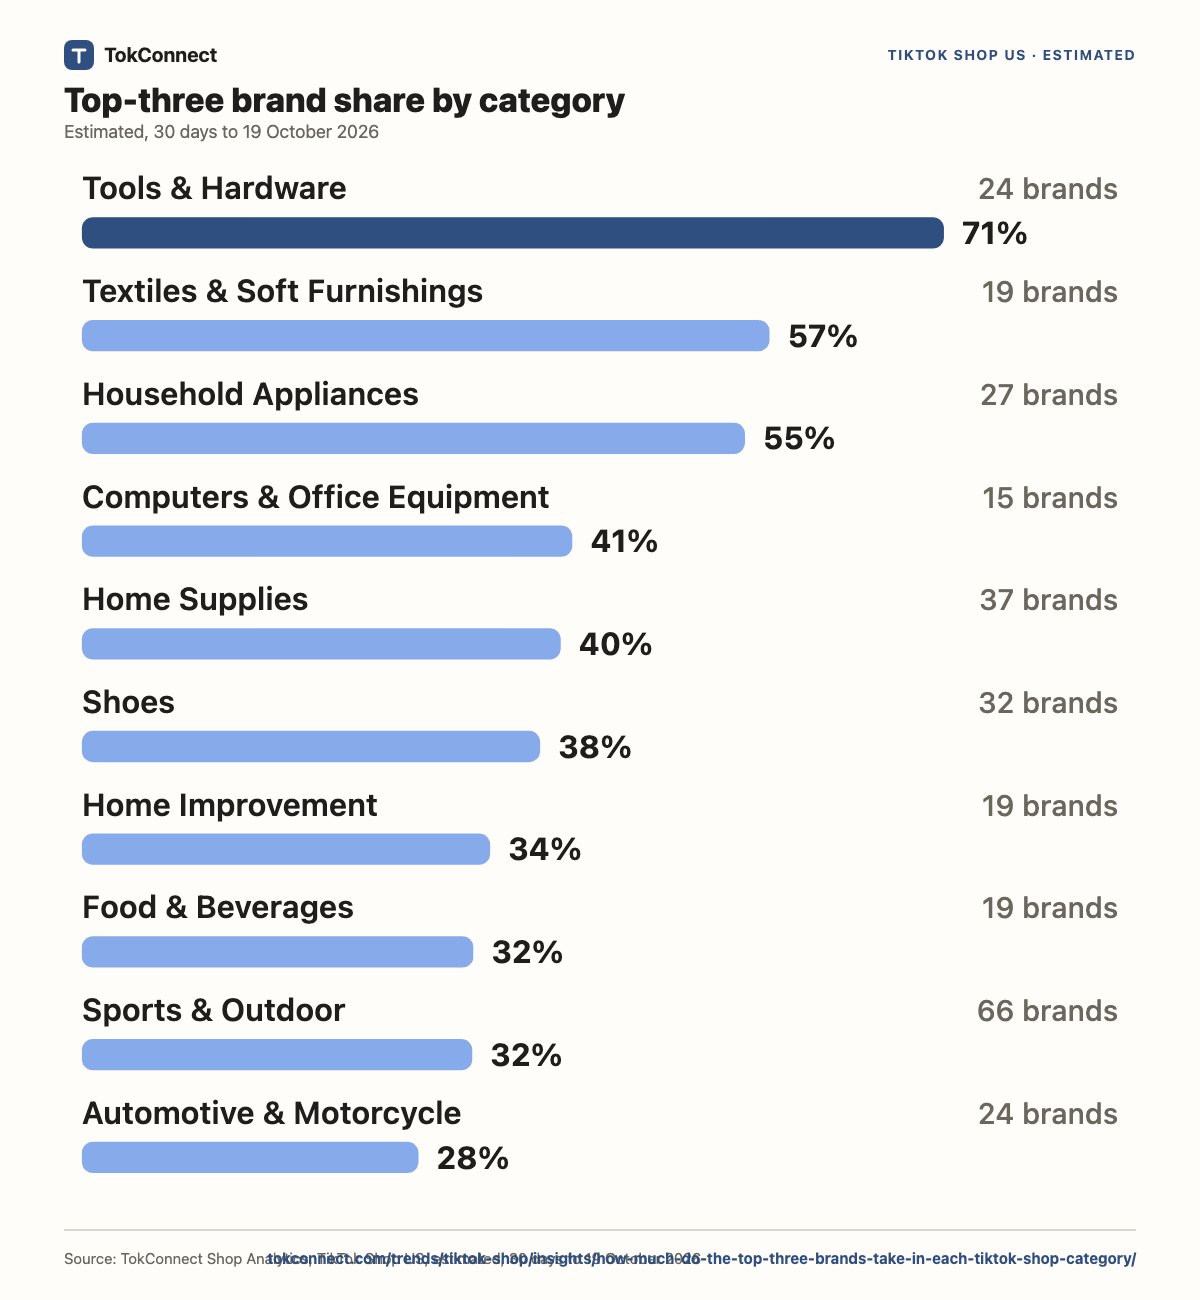
In the 30 days to 19 October 2026 the top three brands took between 15% of revenue in Phones & Electronics and 71% in Tools & Hardware, across 18 categories with 15 or more tracked brands. The median category gives its top three brands 30%, and 9 of 18 categories give them 30% or more.
Key statistics
Free to quote and share with a link to this page. Each figure comes from the data listed under Method and sources.
The top three brands take 71.5% of tracked revenue in Tools & Hardware, the most concentrated of 18 categories (30 days to 19 October 2026).
The top three take 14.8% in Phones & Electronics, the least concentrated (30 days to 19 October 2026).
The median category gives its top three brands 30.1% of revenue (30 days to 19 October 2026).
It takes 1 brands in Tools & Hardware and 30 in Beauty & Personal Care to make half of a category's tracked revenue.
9 of 18 categories give their top three brands 30% or more of tracked revenue (30 days to 19 October 2026).
Where three brands dominate
Tools & Hardware is the most concentrated (71% to its top three, 24 brands) and Phones & Electronics the least (15%, 60 brands). Categories with fewer brands tend to be more concentrated.
TokConnect Shop Analytics, TikTok Shop US, estimated, 30 days to 19 October 2026
Show the numbers as a table
| Category | Brands | Est. revenue | Top brand | Top three | Top ten |
|---|---|---|---|---|---|
| Tools & Hardware | 24 | $41.56M | 50.1% | 71.5% | 86.4% |
| Textiles & Soft Furnishings | 19 | $18.62M | 37.5% | 57.0% | 84.6% |
| Household Appliances | 27 | $34.50M | 24.7% | 55.0% | 78.8% |
| Computers & Office Equipment | 15 | $8.41M | 15.0% | 40.7% | 82.1% |
| Home Supplies | 37 | $24.70M | 27.6% | 39.7% | 60.4% |
| Shoes | 32 | $42.41M | 19.8% | 38.0% | 68.5% |
| Home Improvement | 19 | $15.66M | 14.8% | 33.8% | 74.9% |
| Food & Beverages | 19 | $10.49M | 13.5% | 32.5% | 73.0% |
| Sports & Outdoor | 66 | $63.63M | 22.2% | 32.4% | 54.0% |
| Automotive & Motorcycle | 24 | $11.44M | 12.8% | 27.9% | 62.0% |
| Collectibles | 26 | $11.86M | 8.9% | 23.7% | 57.0% |
| Health | 71 | $61.51M | 10.4% | 22.0% | 44.4% |
| Menswear & Underwear | 42 | $27.22M | 7.6% | 21.6% | 51.4% |
| Fashion Accessories | 65 | $37.35M | 9.3% | 20.0% | 41.4% |
| Beauty & Personal Care | 231 | $241.18M | 12.0% | 19.9% | 32.5% |
| Furniture | 54 | $34.99M | 6.7% | 19.4% | 44.2% |
| Womenswear & Underwear | 167 | $188.22M | 8.0% | 15.7% | 32.6% |
| Phones & Electronics | 60 | $36.44M | 5.5% | 14.8% | 35.8% |
Go deeper in TokConnectIn [my category] on TikTok Shop US, how much do the top 3 brands take of 30-day revenue, and which brands beat the category's change in the last 7 days?
Who takes the rest in the biggest categories
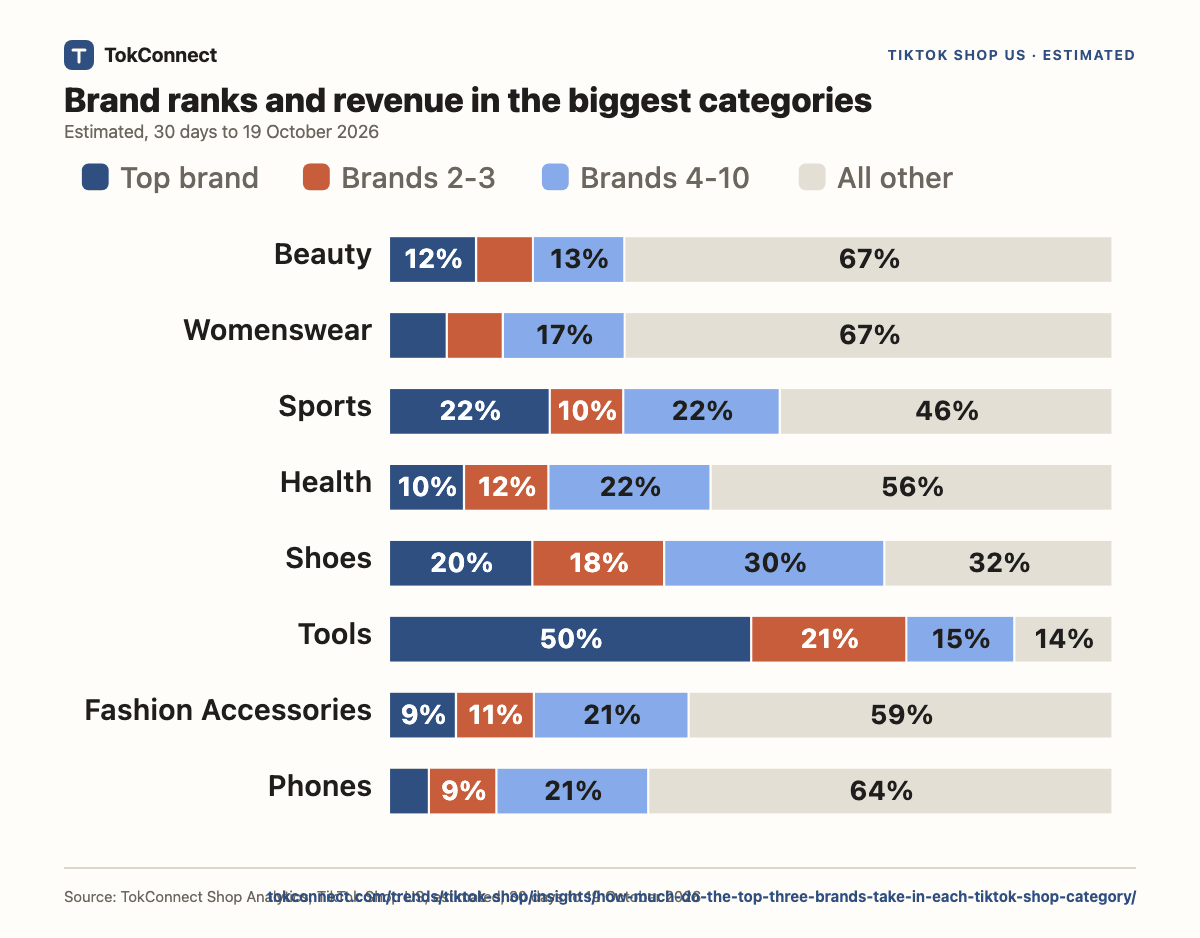
In the 8 biggest categories the top brand takes 6% to 50% of revenue. The brands ranked 4 to 10 take 13% to 30%.
TokConnect Shop Analytics, TikTok Shop US, estimated, 30 days to 19 October 2026
Show the numbers as a table
| Category | Top brand | Brands 2 and 3 | Brands 4 to 10 | All other |
|---|---|---|---|---|
| Beauty & Personal Care | 12.0% | 7.9% | 12.6% | 67.5% |
| Womenswear & Underwear | 8.0% | 7.7% | 16.8% | 67.4% |
| Sports & Outdoor | 22.2% | 10.2% | 21.6% | 46.0% |
| Health | 10.4% | 11.7% | 22.4% | 55.6% |
| Shoes | 19.8% | 18.2% | 30.4% | 31.5% |
| Tools & Hardware | 50.1% | 21.4% | 14.9% | 13.6% |
| Fashion Accessories | 9.3% | 10.8% | 21.4% | 58.6% |
| Phones & Electronics | 5.5% | 9.3% | 21.0% | 64.2% |
How many brands it takes to make half
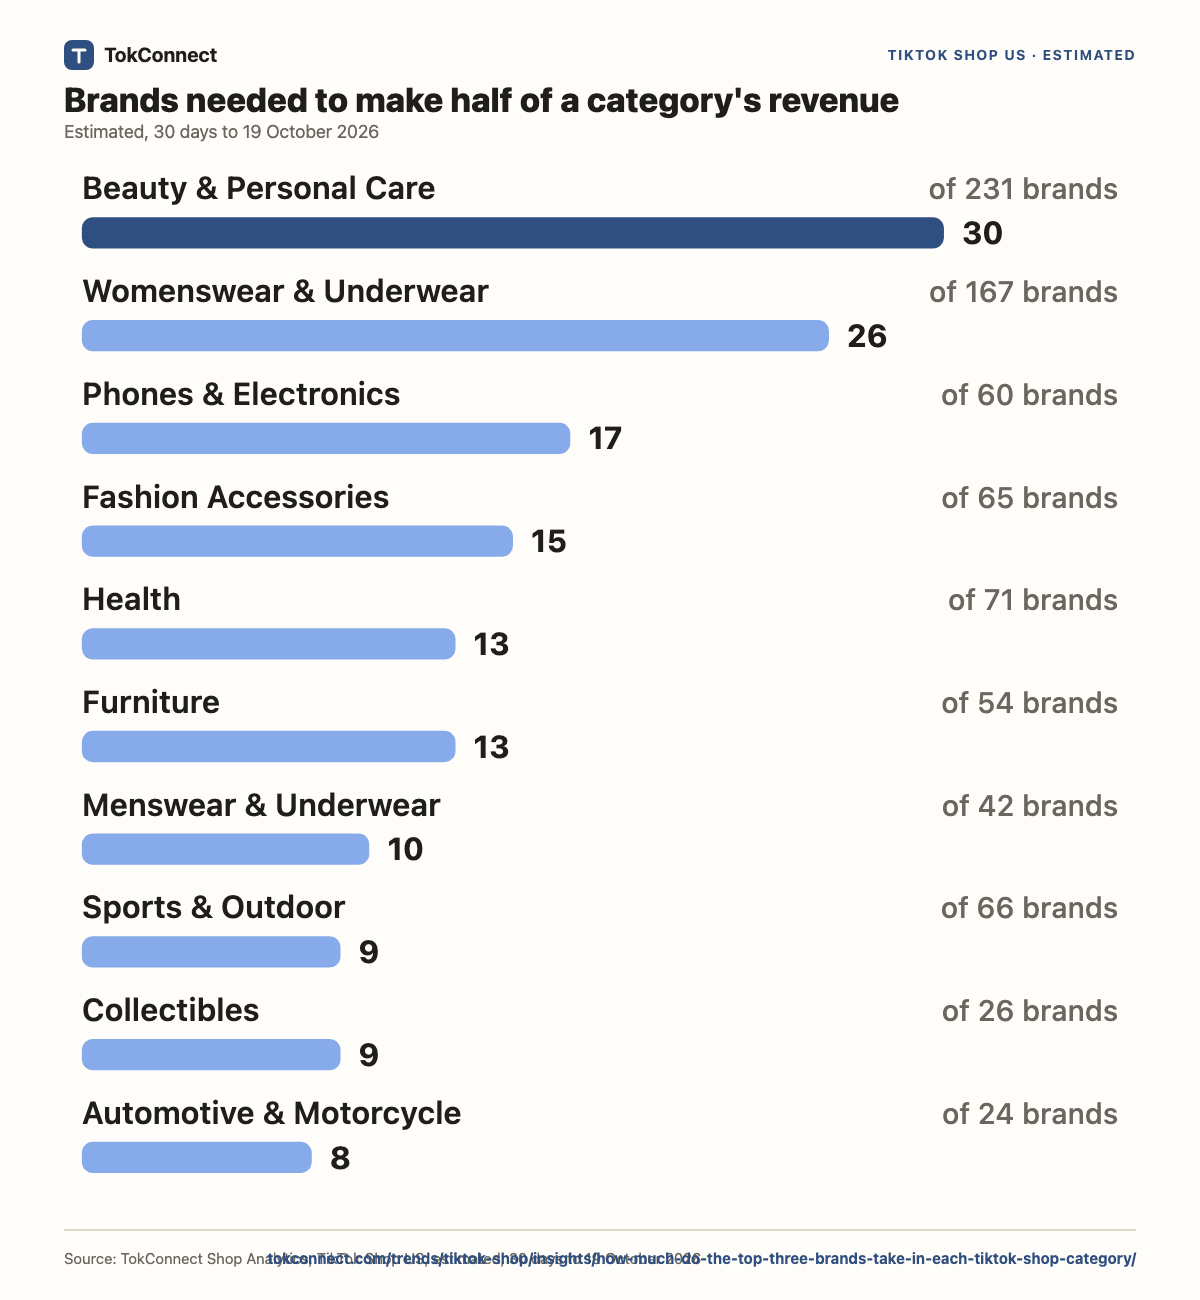
Half of the tracked revenue in Tools & Hardware sits with 1 brands; in Beauty & Personal Care it takes 30.
TokConnect Shop Analytics, TikTok Shop US, estimated, 30 days to 19 October 2026
Show the numbers as a table
| Category | Brands | Brands that make half |
|---|---|---|
| Beauty & Personal Care | 231 | 30 |
| Womenswear & Underwear | 167 | 26 |
| Phones & Electronics | 60 | 17 |
| Fashion Accessories | 65 | 15 |
| Health | 71 | 13 |
| Furniture | 54 | 13 |
| Menswear & Underwear | 42 | 10 |
| Sports & Outdoor | 66 | 9 |
| Collectibles | 26 | 9 |
| Automotive & Motorcycle | 24 | 8 |
| Home Supplies | 37 | 7 |
| Shoes | 32 | 6 |
| Food & Beverages | 19 | 6 |
| Computers & Office Equipment | 15 | 5 |
| Home Improvement | 19 | 5 |
| Textiles & Soft Furnishings | 19 | 3 |
| Household Appliances | 27 | 3 |
| Tools & Hardware | 24 | 1 |
What this means
For brands
In Tools & Hardware the top three hold 71% of tracked revenue and it takes 1 brands to make half. In Phones & Electronics they hold 15% and it takes 17, so revenue is spread more widely.
For affiliates
In concentrated categories a few brands set the price and the creative. Where the top three hold under 30%, revenue is spread across many brands, so more offers are worth checking.
For sellers
Check your category's top-three share before you plan share of voice: it runs from 15% to 71% across categories, with a median of 30%.
What TokConnect adds to this study
This page is one snapshot of one question. TokConnect runs the same Shop Analytics live, for your own niche, brand or product, down to the creator, the video and the LIVE.
- Your category's top 3List the top 3 TikTok Shop US brands in [my category] by 30-day revenue and the share of the category they take.Ask in TokConnect
- Challenger brandsWhich TikTok Shop US brands in [my category] ranked outside the top 10 but changed 30% or more above their category in the last 7 days?Ask in TokConnect
- Subcategory viewRepeat the top-three share for the TikTok Shop US subcategory [subcategory].Ask in TokConnect
- A leader up closeShow how [leader brand] earns on TikTok Shop US: channel split, top products and the creators behind its sales.Ask in TokConnect
50 free credits, no card, failed calls are free. Works in , , and TokConnect Chat. Try the free TikTok Shop analytics tool or read the TikTok Shop MCP guide.
Questions about this study
Which TikTok Shop category is dominated by a few brands?
Tools & Hardware: its top three brands take 71% of tracked revenue, among categories with 15 or more brands.
Which TikTok Shop category is the most competitive?
Phones & Electronics, where the top three take only 15% and 17 brands make half of the revenue.
How much do the top three brands take in a typical category?
A median of 30% of tracked revenue in the 30 days to 19 October 2026.
How is a brand's category decided?
By its main category as the source files it. Storefronts of one brand are merged first.
Why only categories with 15 or more brands?
Shares are not meaningful when a category has a handful of brands, so smaller categories are left out.
Method and sources
Estimated from TikTok Shop sold counts and listed prices, 30 days to 19 October 2026. The shop pool holds every shop with $250K or more of estimated revenue in 30 days that the source returned for 29 search characters across 6 revenue bands (1,337 shops; storefronts of one brand are merged, leaving 1,070 brands). A category needs 15 or more tracked brands to appear. Shops the source flags as price-suspect are dropped, and their revenue is in no figure here. Category is the shop's main category as the source files it. Totals are sums over these tracked brands, not the size of the market. Pulled 21 October 2026, data to 19 October 2026. Read the full method and corrections policy. Questions or corrections: dj@tokconnect.com.