Streams, not only videos
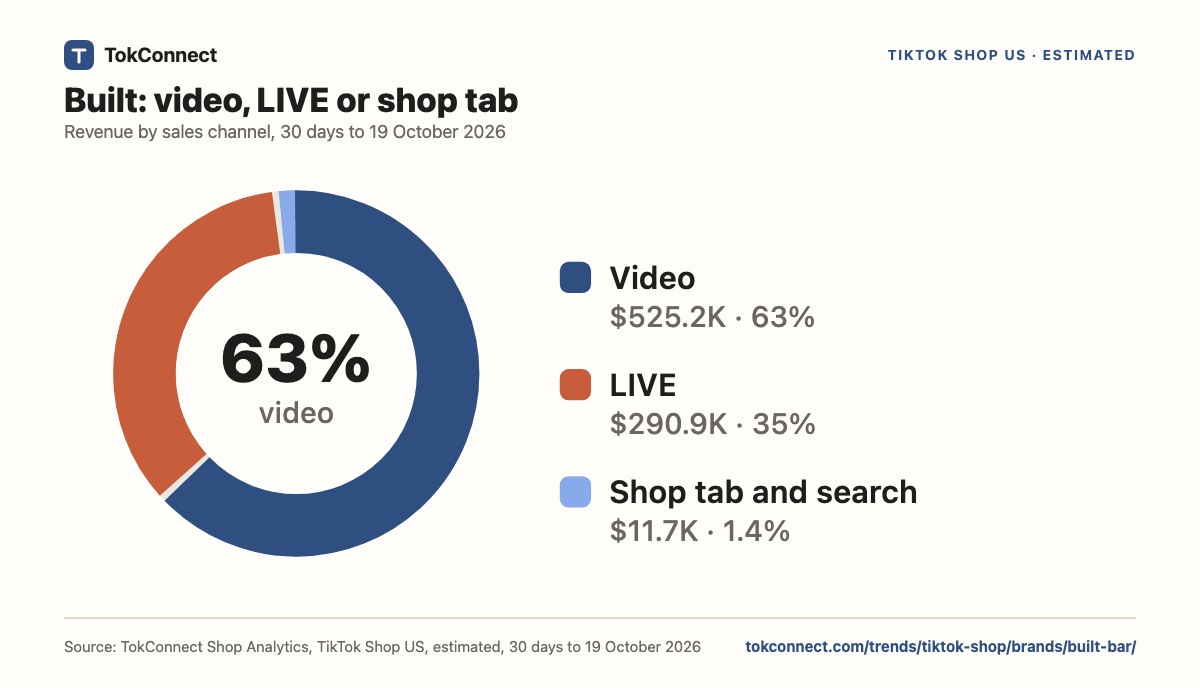
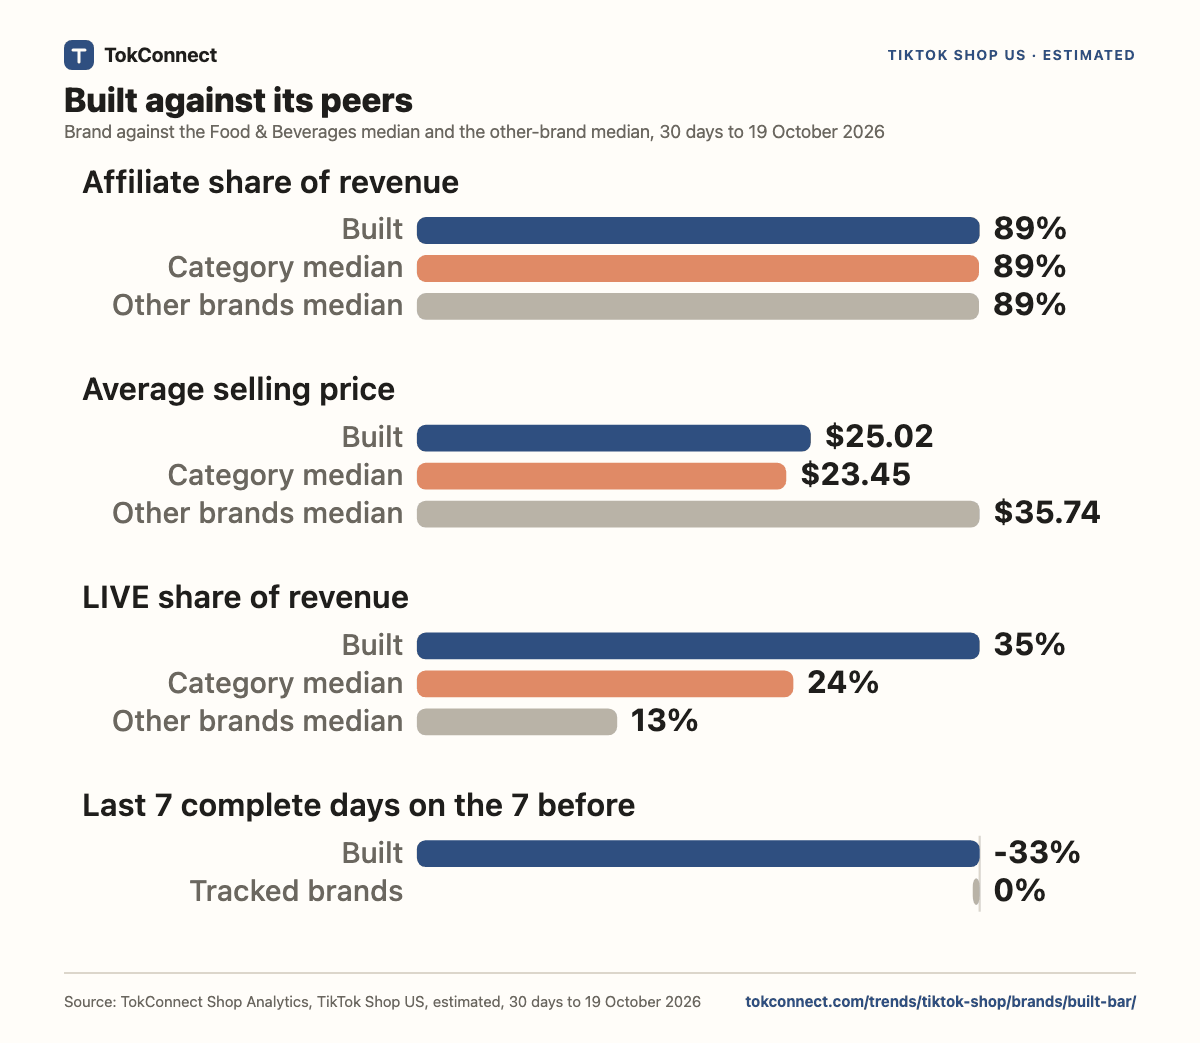
35% of revenue ($290.9K) came from LIVE. The median tracked brand gets 13% from LIVE.
30 days to 19 October 2026Source: TikTok Creator Search Insights via TokConnect, 21 October 2026. Search counts are TikTok's figure for the last 7 days; the arrow compares the latest reading with the average of the previous six days. TikTok Shop items: estimated revenue, TikTok Shop US, 30 days to 18 October 2026, growth against the 30 days before.
 tokconnectStart free
By DanielUpdated 21 October 2026Data to 19 October 202630 days from 20 SeptemberTikTok Shop US, estimatedHow this is estimated
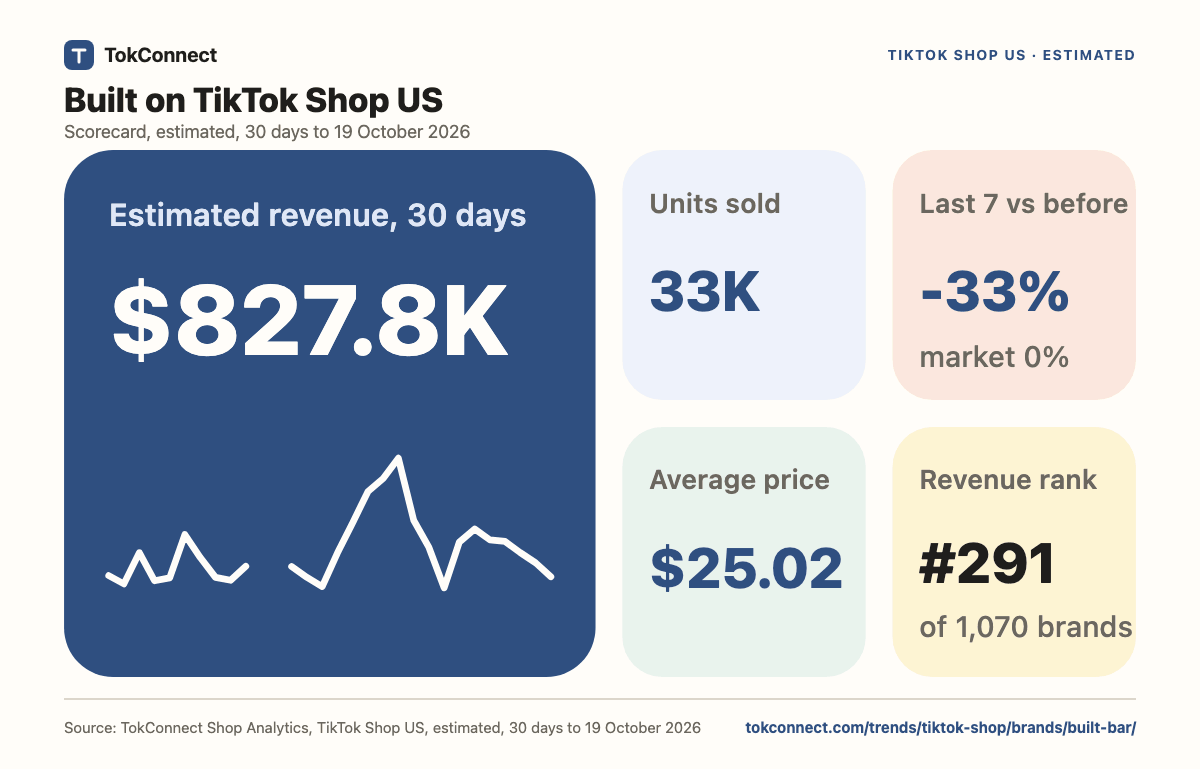
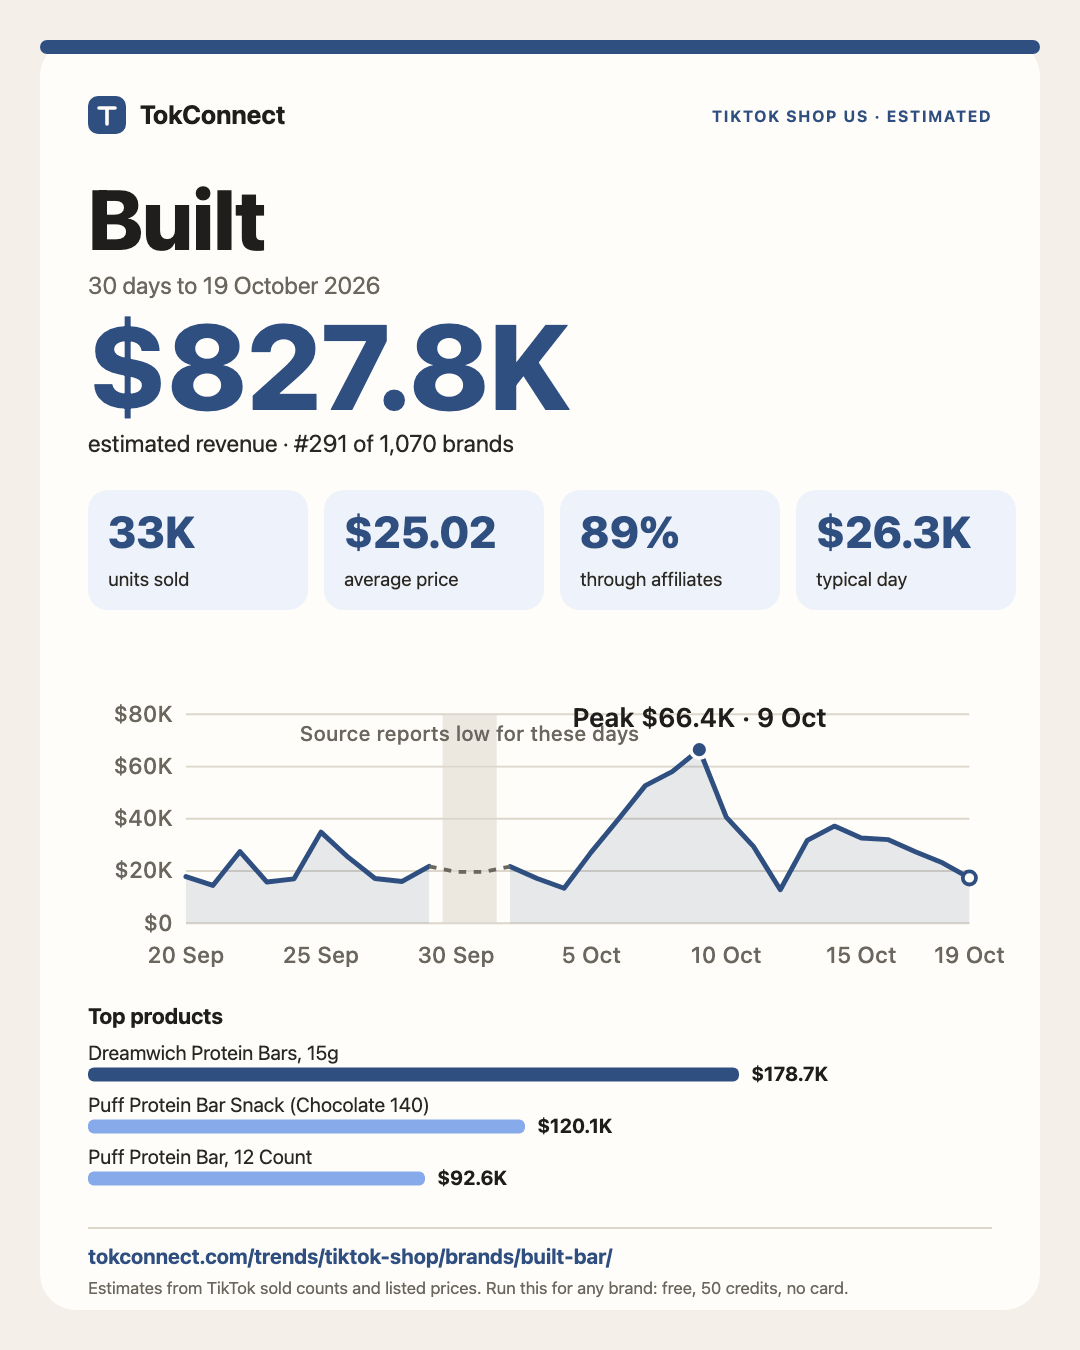
In the 30 days to 19 October 2026, Built made an estimated $827.8K on TikTok Shop US, per TokConnect Shop Analytics (33K units, $25.02 on average). That ranks #291 of 1,070 tracked brands, and #3 of 19 in Food & Beverages as the source files it. LIVE streams made 35% of source revenue.
Revenue for 30 Sep and 1 Oct is reported low across the whole data source, so 30-day totals can read a little low.
Free to quote and share with a link to this page. Each figure comes from the data listed under Method and sources.
Built made an estimated $827.8K on TikTok Shop US in the 30 days to 19 October 2026.
Built sold an estimated 33K units at an average price of $25.02 in the 30 days to 19 October 2026.
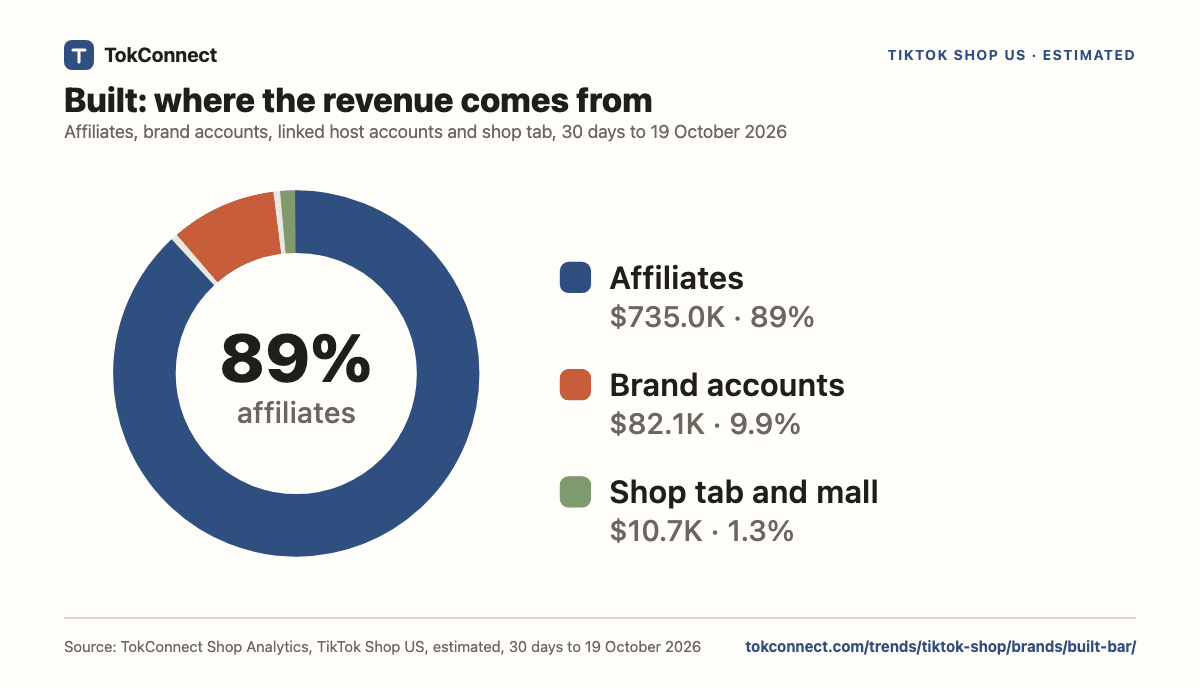
Affiliate creators drove 89% of Built's estimated TikTok Shop source revenue in the 30 days to 19 October 2026; accounts carrying its own name made 9.9%.
Built ranks #291 of 1,070 tracked TikTok Shop brands by estimated revenue in the 30 days to 19 October 2026 and #3 of 19 in Food & Beverages.
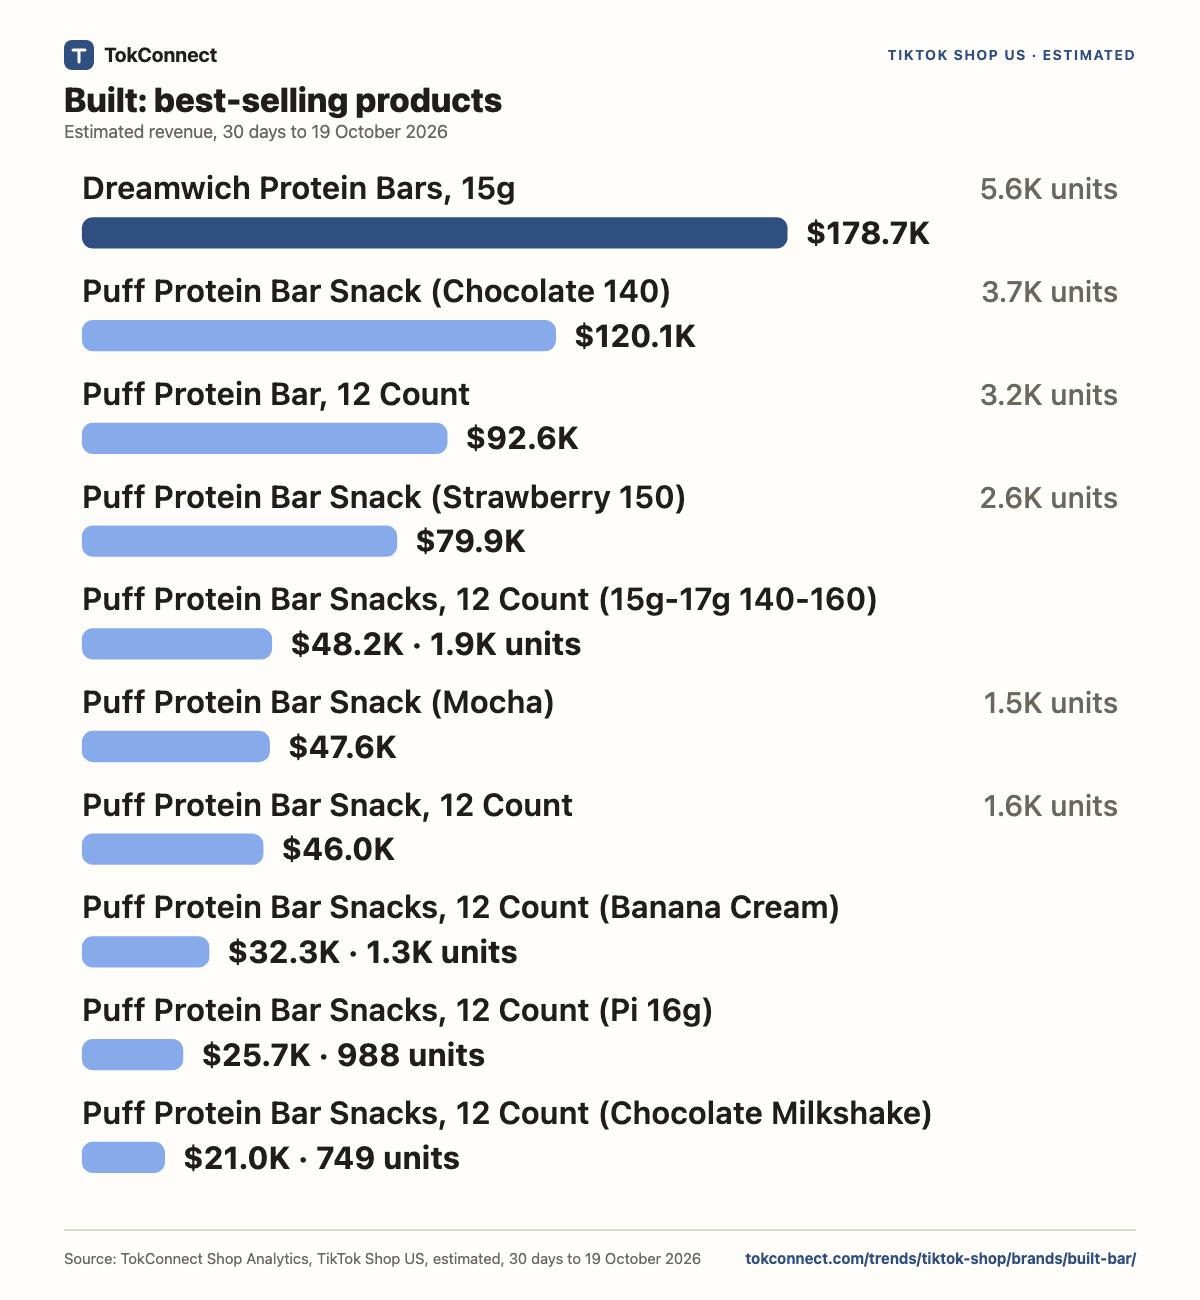
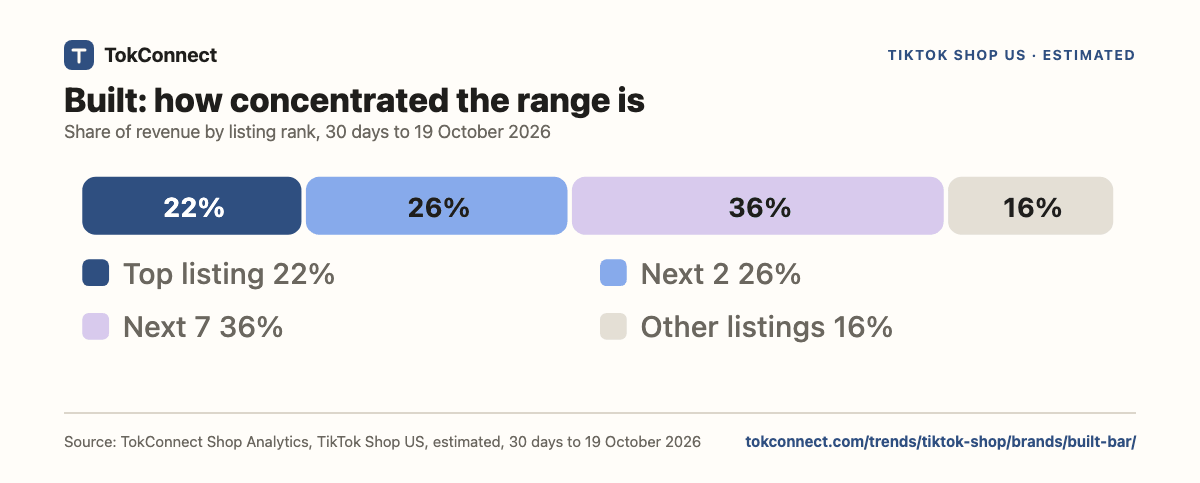
Dreamwich Protein Bars, 15g was Built's best-selling listing: an estimated $178.7K, 22% of headline revenue, in the 30 days to 19 October 2026.
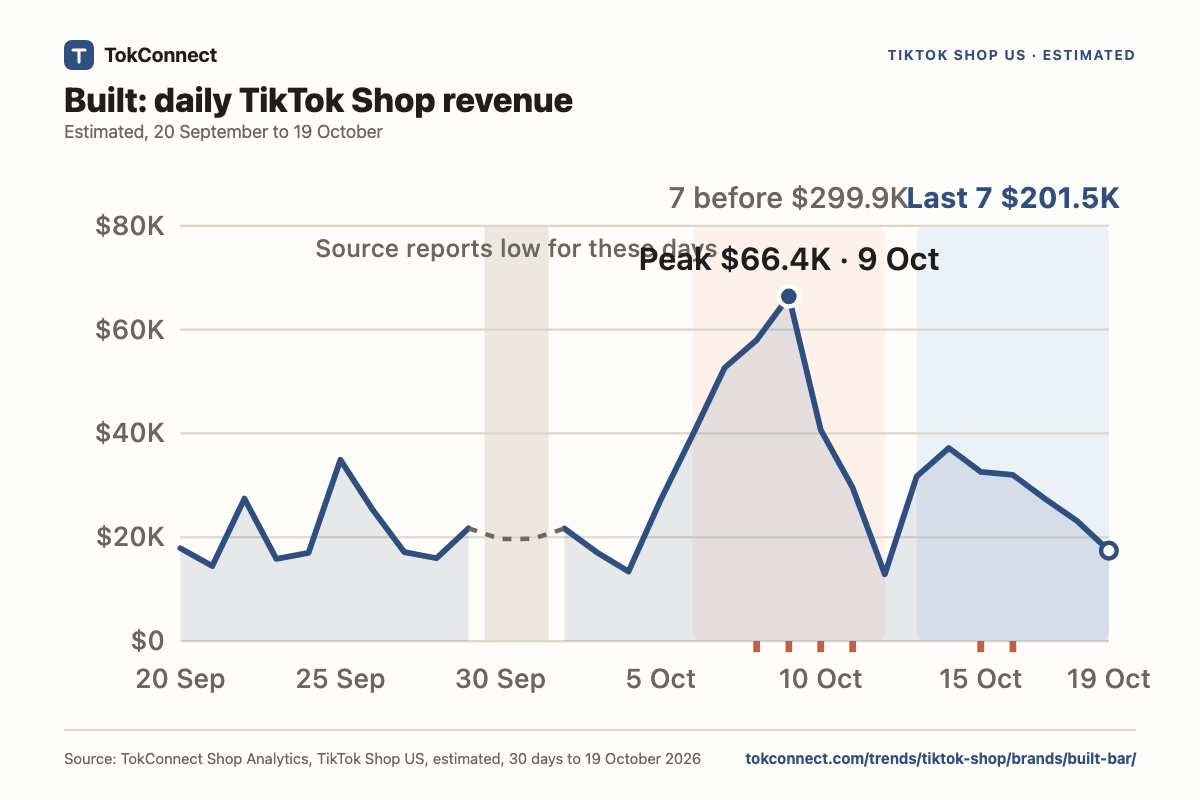
Over 13 to 19 October, the last 7 complete days, Built brought in $201.5K, down 33% on the 7 days before ($299.9K). Across the tracked brands the same comparison was unchanged (partly a platform-wide surge in those days). The 7 days before include the 3-day peak of 7 to 9 October, which accounts for most of the gap to the tracked brands.
35% of revenue ($290.9K) came from LIVE. The median tracked brand gets 13% from LIVE.
30 days to 19 October 2026Dreamwich Protein Bars, 15g, Puff Protein Bar Snack (Chocolate 140) and Puff Protein Bar, 12 Count made 47% of Built's revenue between them, an estimated $391.4K.
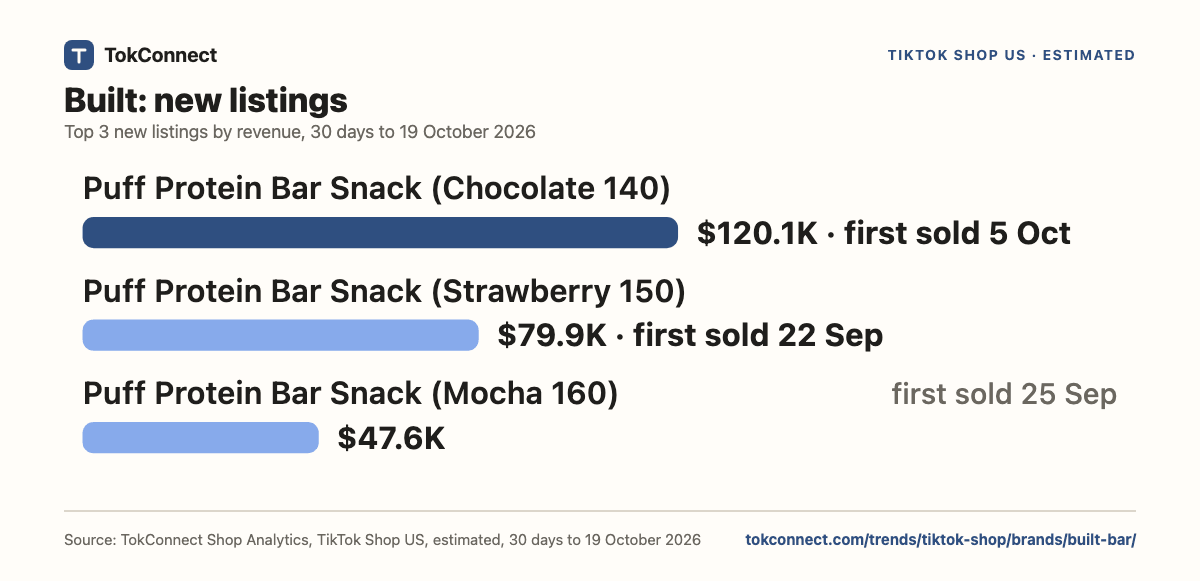
30 days to 19 October 20263 products first sold in the window earned an estimated $247.6K (30% of revenue). The best, Puff Protein Bar Snack (Chocolate 140), made $120.1K since 5 Oct.
30 days to 19 October 2026Built is #291 of 1,070 tracked brands by estimated 30-day revenue, and #3 of 19 in Food & Beverages as the source files it. The leader in Food & Beverages, RYZE Superfoods, made $1.42M. Built holds 7.9% of the revenue of the 19 Food & Beverages brands tracked.
30 days to 19 October 202610% of source revenue ($82.1K) came through accounts named after the brand. The median tracked brand gets 4.0% through all its own and linked accounts together.
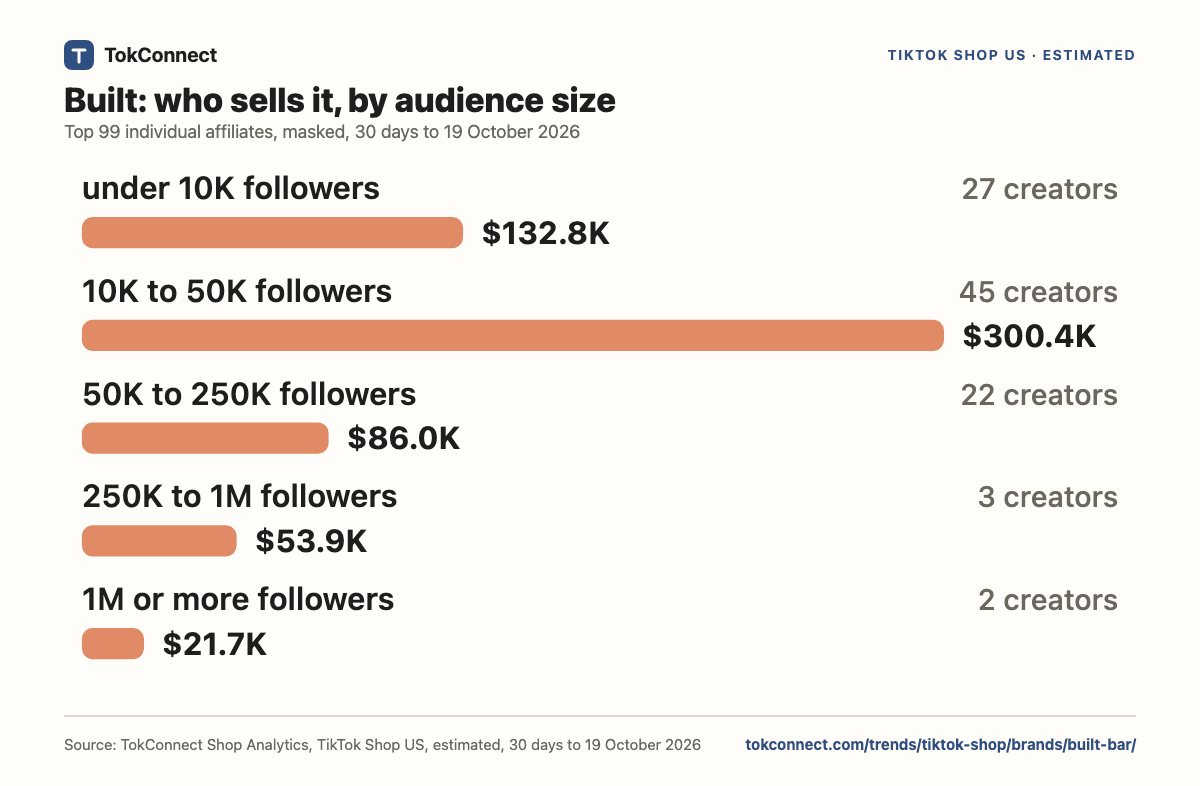
30 days to 19 October 2026Affiliates with under 50K followers made 73% of the revenue of the top 99 affiliates, and they are 72 of them.
30 days to 19 October 2026Go deeper in TokConnectWhich Built products grew fastest on TikTok Shop in the last 7 days, and who is selling them?
BUILT is a protein snack brand best known for the BUILT Puff, and its site also lists the Dreamwich. It sells on built.com and at retailers.
3 days in a row (7 to 9 October) ran at $52.7K to $66.4K a day, against a typical day of $26.3K. Over 13 to 19 October, the last 7 complete days, Built brought in $201.5K, down 33% on the 7 days before ($299.9K). Across the tracked brands the same comparison was unchanged (partly a platform-wide surge in those days). The 7 days before include the 3-day peak of 7 to 9 October, which accounts for most of the gap to the tracked brands.
The top three listings make 47%, led by Dreamwich Protein Bars, 15g at 22%. The 3 listings new this month made 30%. Only 1.4% comes from the shop tab and search, so a competitor needs affiliate and LIVE volume to match it, not search placement.
Analyst note based on this page's numbers and the sources listed below, updated 21 October 2026. How these pages are made. Outside facts: BUILT about page.
TokConnect Shop Analytics, TikTok Shop US, estimated, 30 days to 19 October 2026
| Date | Est. revenue | Est. units | Affiliates | Brand and linked accounts | Shop tab and mall | Day |
|---|---|---|---|---|---|---|
| 20 September | $17.9K | 714 | $17.5K | $322 | $22 | complete |
| 21 September | $14.5K | 594 | $14.1K | $243 | $100 | complete |
| 22 September | $27.4K | 1,172 | $22.8K | $4.4K | $266 | complete |
| 23 September | $15.8K | 675 | $13.3K | $2.3K | $169 | complete |
| 24 September | $17.0K | 770 | $14.3K | $2.5K | $224 | complete |
| 25 September | $34.9K | 1,377 | $29.1K | $5.3K | $501 | complete |
| 26 September | $25.3K | 971 | $22.4K | $2.7K | $240 | complete |
| 27 September | $17.1K | 701 | $15.4K | $1.6K | $56 | complete |
| 28 September | $16.0K | 616 | $14.8K | $802 | $391 | complete |
| 29 September | $21.7K | 876 | $16.7K | $4.9K | $153 | complete |
| 30 September | $19.7K | 793 | $16.9K | $2.8K | $0 | source reports low |
| 1 October | $19.7K | 829 | $17.0K | $2.7K | $59 | source reports low |
| 2 October | $21.7K | 874 | $18.0K | $3.4K | $252 | complete |
| 3 October | $17.1K | 712 | $14.1K | $2.5K | $495 | complete |
| 4 October | $13.4K | 560 | $13.4K | $0 | $62 | complete |
| 5 October | $27.2K | 1,081 | $27.1K | $0 | $154 | complete |
| 6 October | $39.7K | 1,671 | $32.2K | $7.4K | $101 | complete |
| 7 October | $52.7K | 2,042 | $46.4K | $6.2K | $121 | complete |
| 8 October | $58.0K | 2,022 | $50.7K | $6.3K | $993 | complete |
| 9 October | $66.4K | 2,236 | $61.3K | $4.7K | $404 | complete |
| 10 October | $40.7K | 1,628 | $37.6K | $2.7K | $385 | complete |
| 11 October | $29.5K | 1,154 | $25.4K | $336 | $3.8K | complete |
| 12 October | $12.8K | 599 | $12.8K | $0 | $0 | complete |
| 13 October | $31.7K | 1,350 | $26.8K | $4.8K | $56 | complete |
| 14 October | $37.2K | 1,489 | $33.4K | $3.7K | $199 | complete |
| 15 October | $32.6K | 1,356 | $28.8K | $3.6K | $214 | complete |
| 16 October | $32.0K | 1,323 | $28.3K | $3.3K | $434 | complete |
| 17 October | $27.4K | 1,210 | $24.6K | $2.6K | $241 | complete |
| 18 October | $23.1K | 1,009 | $22.5K | $104 | $520 | complete |
| 19 October | $17.4K | 679 | $17.4K | $0 | $11 | complete |
TokConnect Shop Analytics, TikTok Shop US, estimated, 30 days to 19 October 2026
| Source | Est. revenue | Share of source total |
|---|---|---|
| Affiliates | $735.0K | 88.8% |
| Brand accounts | $82.1K | 9.9% |
| Shop tab and mall | $10.7K | 1.3% |
TokConnect Shop Analytics, TikTok Shop US, estimated, 30 days to 19 October 2026
| Channel | Est. revenue | Share of source total |
|---|---|---|
| Video | $525.2K | 63.4% |
| LIVE | $290.9K | 35.1% |
| Shop tab and search | $11.7K | 1.4% |
TokConnect Shop Analytics, TikTok Shop US, estimated, 30 days to 19 October 2026
| # | Product | Est. revenue | Est. units | Avg price | Share of headline revenue |
|---|---|---|---|---|---|
| 1 | Dreamwich Protein Bars, 15g | $178.7K | 5.6K | $31.97 | 21.6% |
| 2 | Puff Protein Bar Snack (Chocolate 140) | $120.1K | 3.7K | $32.72 | 14.5% |
| 3 | Puff Protein Bar, 12 Count | $92.6K | 3.2K | $29.03 | 11.2% |
| 4 | Puff Protein Bar Snack (Strawberry 150) | $79.9K | 2.6K | $30.61 | 9.6% |
| 5 | Puff Protein Bar Snacks, 12 Count (15g-17g 140-160) | $48.2K | 1.9K | $26.04 | 5.8% |
| 6 | Puff Protein Bar Snack (Mocha) | $47.6K | 1.5K | $30.93 | 5.8% |
| 7 | Puff Protein Bar Snack, 12 Count | $46.0K | 1.6K | $28.92 | 5.6% |
| 8 | Puff Protein Bar Snacks, 12 Count (Banana Cream) | $32.3K | 1.3K | $25.05 | 3.9% |
| 9 | Puff Protein Bar Snacks, 12 Count (Pi 16g) | $25.7K | 988 | $26.00 | 3.1% |
| 10 | Puff Protein Bar Snacks, 12 Count (Chocolate Milkshake) | $21.0K | 749 | $28.09 | 2.5% |
TokConnect Shop Analytics, TikTok Shop US, estimated, 30 days to 19 October 2026
| Group | Share of headline revenue |
|---|---|
| Top listing | 21.6% |
| Listings 2 and 3 | 25.7% |
| Listings 4 to 10 | 36.3% |
| Other listings | 16.4% |
TokConnect Shop Analytics, TikTok Shop US, estimated, 30 days to 19 October 2026
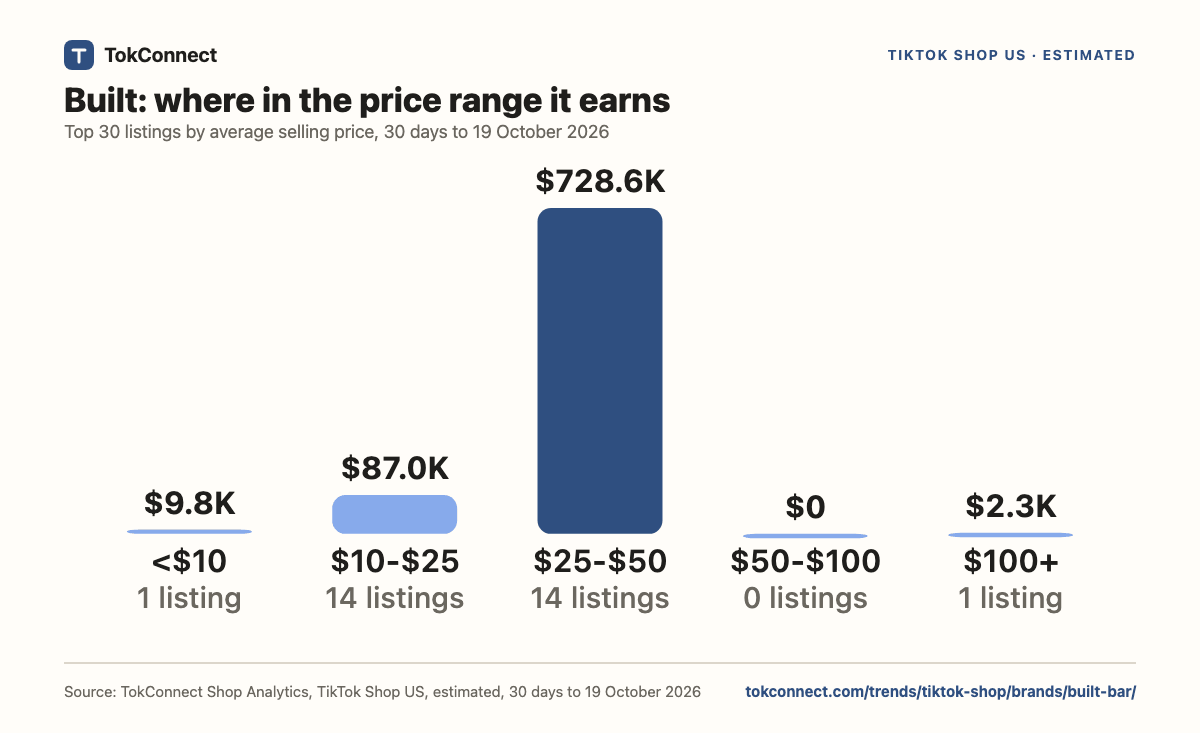
| Price band | Listings | Est. revenue | Share of the top listings |
|---|---|---|---|
| Under $10 | 1 | $9.8K | 1.2% |
| $10 to $25 | 14 | $87.0K | 10.5% |
| $25 to $50 | 14 | $728.6K | 88.0% |
| $50 to $100 | 0 | $0 | 0.0% |
| $100 and up | 1 | $2.3K | 0.3% |
TokConnect Shop Analytics, TikTok Shop US, estimated, 30 days to 19 October 2026
| First sold | Product | Est. revenue |
|---|---|---|
| 22 September | Puff Protein Bar Snack (Strawberry 150) | $79.9K |
| 25 September | Puff Protein Bar Snack (Mocha 160) | $47.6K |
| 5 October | Puff Protein Bar Snack (Chocolate 140) | $120.1K |
TokConnect Shop Analytics, TikTok Shop US, estimated, 30 days to 19 October 2026
| Measure | Group | Value |
|---|---|---|
| Affiliate share of revenue | Built | 89% |
| Affiliate share of revenue | Category median | 89% |
| Affiliate share of revenue | Other brands median | 89% |
| Average selling price | Built | $25.02 |
| Average selling price | Category median | $23.45 |
| Average selling price | Other brands median | $35.74 |
| LIVE share of revenue | Built | 35% |
| LIVE share of revenue | Category median | 24% |
| LIVE share of revenue | Other brands median | 13% |
| Last 7 complete days on the 7 before | Built | -33% |
| Last 7 complete days on the 7 before | Tracked brands | 0% |
TokConnect Shop Analytics, TikTok Shop US, estimated, 30 days to 19 October 2026
| Follower band | Creators | Est. revenue driven | Share |
|---|---|---|---|
| under 10K | 27 | $132.8K | 22.3% |
| 10K to 50K | 45 | $300.4K | 50.5% |
| 50K to 250K | 22 | $86.0K | 14.5% |
| 250K to 1M | 3 | $53.9K | 9.1% |
| 1M or more | 2 | $21.7K | 3.6% |
Go deeper in TokConnectWhich videos and LIVE streams drove Built's TikTok Shop sales in the last 7 days? Show views, revenue and whether they are ads.
Ranked by estimated revenue in the 30 days to 19 October 2026. Commission is the public affiliate rate where the source lists one. Listed is the listing date TikTok shows.
| # | Product | Est. revenue | Est. units | Avg price | Commission | Listed |
|---|---|---|---|---|---|---|
| 1 | Dreamwich Protein Bars, 15g21.6% of revenue | $178.7K | 5.6K | $31.97 | 13% | 7 Sep 2026 |
| 2 | Puff Protein Bar Snack (Chocolate 140)14.5% of revenue | $120.1K | 3.7K | $32.72 | – | 5 Oct 2026 |
| 3 | Puff Protein Bar, 12 Count11.2% of revenue | $92.6K | 3.2K | $29.03 | 14% | 29 Sep 2025 |
| 4 | Puff Protein Bar Snack (Strawberry 150)9.6% of revenue | $79.9K | 2.6K | $30.61 | – | 22 Sep 2026 |
| 5 | Puff Protein Bar Snacks, 12 Count (15g-17g 140-160)5.8% of revenue | $48.2K | 1.9K | $26.04 | 15% | 27 Aug 2024 |
| 6 | Puff Protein Bar Snack (Mocha)5.8% of revenue | $47.6K | 1.5K | $30.93 | – | 25 Sep 2026 |
| 7 | Puff Protein Bar Snack, 12 Count5.6% of revenue | $46.0K | 1.6K | $28.92 | 14% | 7 Jul 2026 |
| 8 | Puff Protein Bar Snacks, 12 Count (Banana Cream)3.9% of revenue | $32.3K | 1.3K | $25.05 | 16% | 5 Sep 2024 |
| 9 | Puff Protein Bar Snacks, 12 Count (Pi 16g)3.1% of revenue | $25.7K | 988 | $26.00 | 15% | 21 Jul 2026 |
| 10 | Puff Protein Bar Snacks, 12 Count (Chocolate Milkshake)2.5% of revenue | $21.0K | 749 | $28.09 | 14% | 21 Jul 2025 |
| 11 | Puff Protein Bars, 17g1.4% of revenue | $11.9K | 1.1K | $10.96 | 9% | 22 Apr 2025 |
| 12 | Puff Protein Bar Snacks, 12 Count (Cinnamon Cereal)1.4% of revenue | $11.4K | 393 | $29.01 | 14% | 6 Aug 2026 |
| 13 | Puff Protein Bar Snacks, 17g (Brownie Batter)1.3% of revenue | $10.4K | 942 | $11.00 | 9% | 1 Aug 2024 |
| 14 | Puff Protein Bar Snack (Cookie Dough)1.2% of revenue | $9.8K | 1.1K | $9.00 | 11% | 1 Aug 2024 |
| 15 | Sour Puff Variety Box Triple Flavor, 12 Count1.2% of revenue | $9.6K | 368 | $26.01 | 15% | 20 Aug 2025 |
Go deeper in TokConnectWhich creators sell Dreamwich Protein Bars, 15g from Built on TikTok Shop, and how much did each one drive in the last 30 days?
3 listings sold for the first time in the 30 days to 19 October 2026, $247.6K together (30% of revenue).
| Product | First sold | Est. revenue | Est. units | Avg price |
|---|---|---|---|---|
| Puff Protein Bar Snack (Chocolate 140) | 5 October | $120.1K | 3.7K | $32.72 |
| Puff Protein Bar Snack (Strawberry 150) | 22 September | $79.9K | 2.6K | $30.61 |
| Puff Protein Bar Snack (Mocha 160) | 25 September | $47.6K | 1.5K | $30.93 |
Accounts on TikTok that carry the brand's own name, with the revenue each sold in the window.
| Account | Followers | Est. revenue | From LIVE | Est. units |
|---|---|---|---|---|
| Built Bar@built.bar | 118K | $82.1K | 85% | 4.1K |
Only accounts whose name or handle is the brand's own name are shown.
A page can only show a snapshot. Ask TokConnect and it runs the same Shop Analytics for Built live, down to the creator, the video and the LIVE.
50 free credits, no card, failed calls are free. Works in , , and TokConnect Chat. Try the free TikTok Shop analytics tool or read the TikTok Shop MCP guide.
An estimated $827.8K of sales over the 30 days to 19 October 2026. Built ranks #291 of 1,070 tracked brands, selling through 1 US storefront.
A typical day brings in about $26.3K. Across the 30 days to 19 October 2026, Built sold an estimated 33K units for $827.8K, $25.02 each on average. Figures are estimates, not the brand's accounts.
By revenue the leader is Dreamwich Protein Bars, 15g: $178.7K, or 22% of the total, from 5.6K units priced at $31.97 (30 days to 19 October 2026). Second and third are Puff Protein Bar Snack (Chocolate 140) ($120.1K) and Puff Protein Bar, 12 Count ($92.6K).
Affiliates account for 89% of the estimated sales, which is $735.0K. The rest splits between brand-named accounts (9.9%), linked host accounts (0%) and the shop tab and mall (1.3%). Window: 30 days to 19 October 2026.
Over 13 to 19 October, the last 7 complete days, Built brought in $201.5K, down 33% on the 7 days before ($299.9K). Across the tracked brands the same comparison was unchanged (partly a platform-wide surge in those days). The 7 days before include the 3-day peak of 7 to 9 October, which accounts for most of the gap to the tracked brands.
Not from Built's books. Units follow TikTok's own sold counter, revenue is units times the price on the listing, and the window is the 30 days to 19 October 2026. See the method and limits.
Estimated from TikTok Shop sold counts and listed prices, 30 days to 19 October 2026. Source: TokConnect Shop Analytics, TikTok Shop US. Units follow TikTok's sold counter and revenue is units times the listed price, so every figure here is an estimate, not Built's own accounts. Pulled on 21 October 2026; the last complete day of data is 19 October 2026. Revenue for 30 Sep and 1 Oct is reported low across the whole data source, so 30-day totals can read a little low. Those days are left out of every peak, growth and typical-day figure and are not estimated. The price check matched 99% of the revenue of the top 30 listings to the source's own flag. Product tables and price bands cover the top 30 listings, 100% of headline revenue; the source counts 30 listings with sales. Ranks and medians compare Built with the 1,070 brands the source tracks at $250K or more in 30 days. Individual affiliate creators are never named; only accounts carrying the brand's own name are. Read the full method and corrections policy. Questions or corrections: dj@tokconnect.com.