How much TikTok Shop video revenue comes from ads?
By DanielUpdated 21 October 2026Data to 19 October 202630 days from 20 SeptemberTikTok Shop US, estimatedHow this is estimated
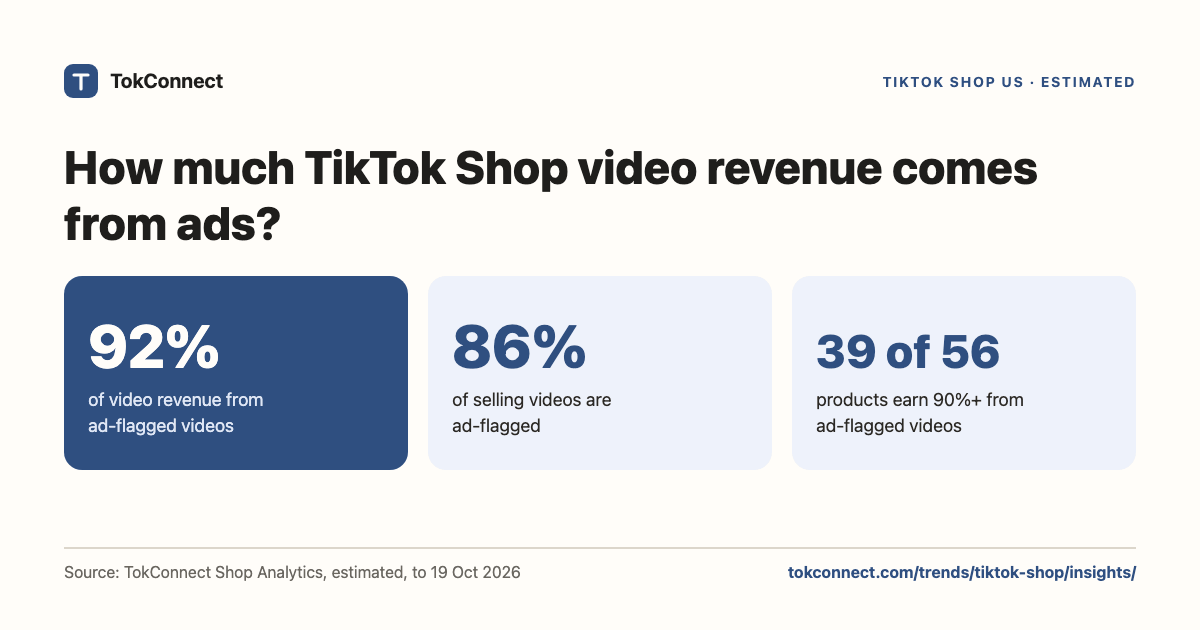
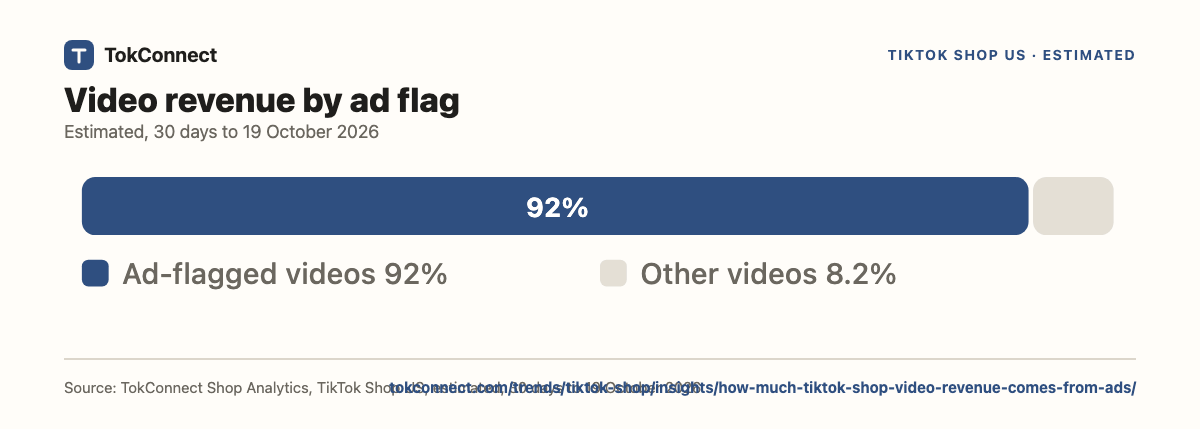
85.9% of the 5,474 selling TikTok Shop US videos in a sample of 60 products are flagged as ads by the source, and they made 91.8% of the $45.24M of estimated revenue in the 30 days to 19 October 2026. 39 of the 56 products earned 90% or more of their video revenue from ad-flagged videos.
Key statistics
Free to quote and share with a link to this page. Each figure comes from the data listed under Method and sources.
Ad-flagged videos made 91.8% of the sample's estimated video revenue, $41.52M of $45.24M (30 days to 19 October 2026).
85.9% of 5,474 selling videos in a sample of 60 TikTok Shop US products are ad-flagged (30 days to 19 October 2026).
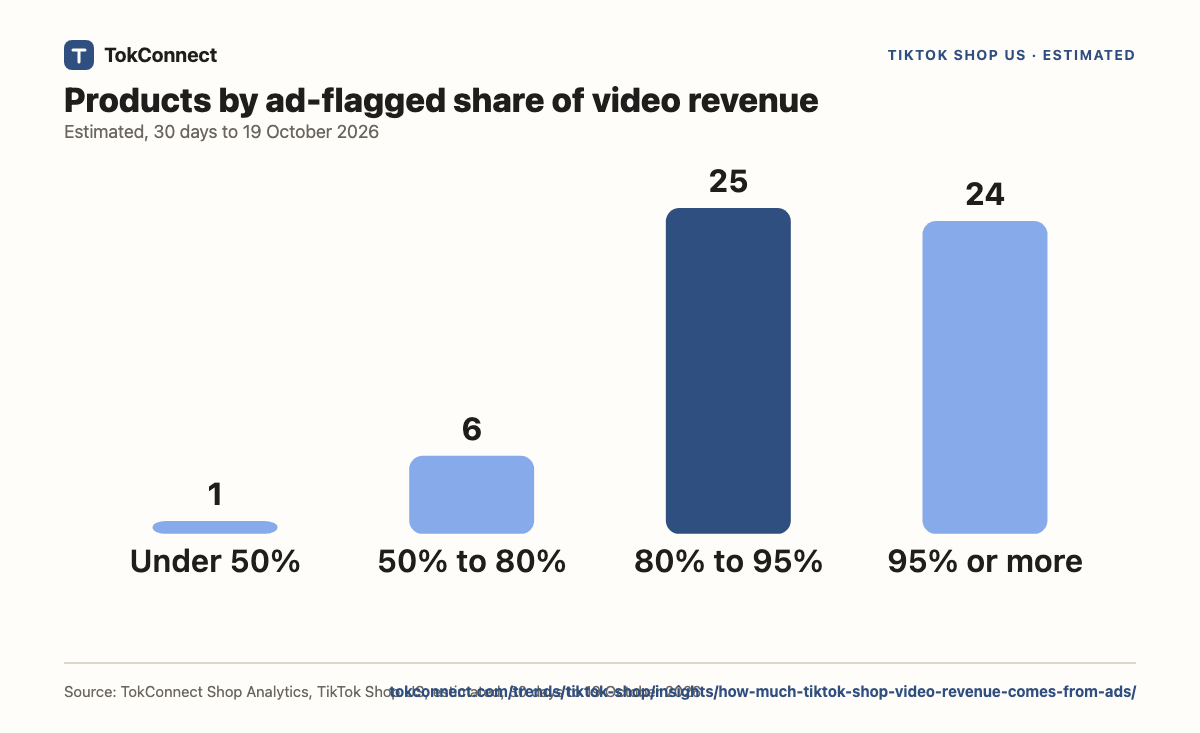
39 of 56 sampled products earned 90% or more of their video revenue from ad-flagged videos, and 55 earned half or more (30 days to 19 October 2026).
The median ad-flagged video earned $2.8K, against $2.1K for the median other video (estimated, 30 days to 19 October 2026).
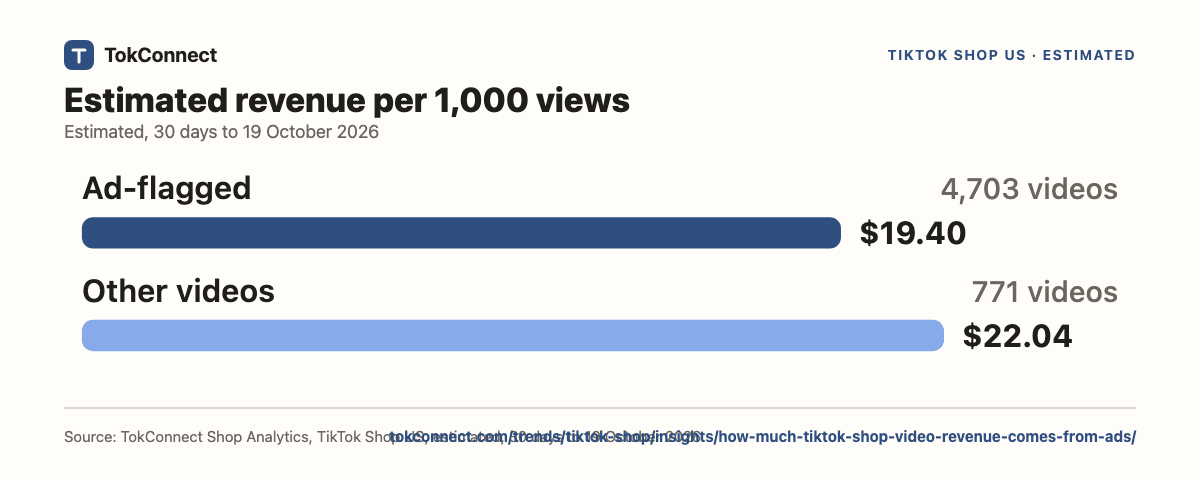
Ad-flagged videos earned $19.40 per 1,000 views and other videos $22.04 (estimated, 30 days to 19 October 2026).
Go deeper in TokConnectFor the TikTok Shop US product [product link], what share of its video revenue comes from ad-flagged videos in the last 30 days, and which videos earn most?
Product by product
24 of 56 products earn 95% or more of their video revenue from ad-flagged videos; 1 earn under half that way.
TokConnect Shop Analytics, TikTok Shop US, estimated, 30 days to 19 October 2026
Show the numbers as a table
| Ad-flagged share of a product's video revenue | Products |
|---|---|
| Under 50% | 1 |
| 50% to 80% | 6 |
| 80% to 95% | 25 |
| 95% or more | 24 |
| All sampled products | 56 |
What an ad-flagged video earns
The median ad-flagged video earned $2.8K and the median other video $2.1K. Per 1,000 views the figures are $19.40 and $22.04.
TokConnect Shop Analytics, TikTok Shop US, estimated, 30 days to 19 October 2026
Show the numbers as a table
| Video type | Median revenue per video | Revenue per 1,000 views |
|---|---|---|
| Ad-flagged | $2.8K | $19.40 |
| Other | $2.1K | $22.04 |
Ad share by video age
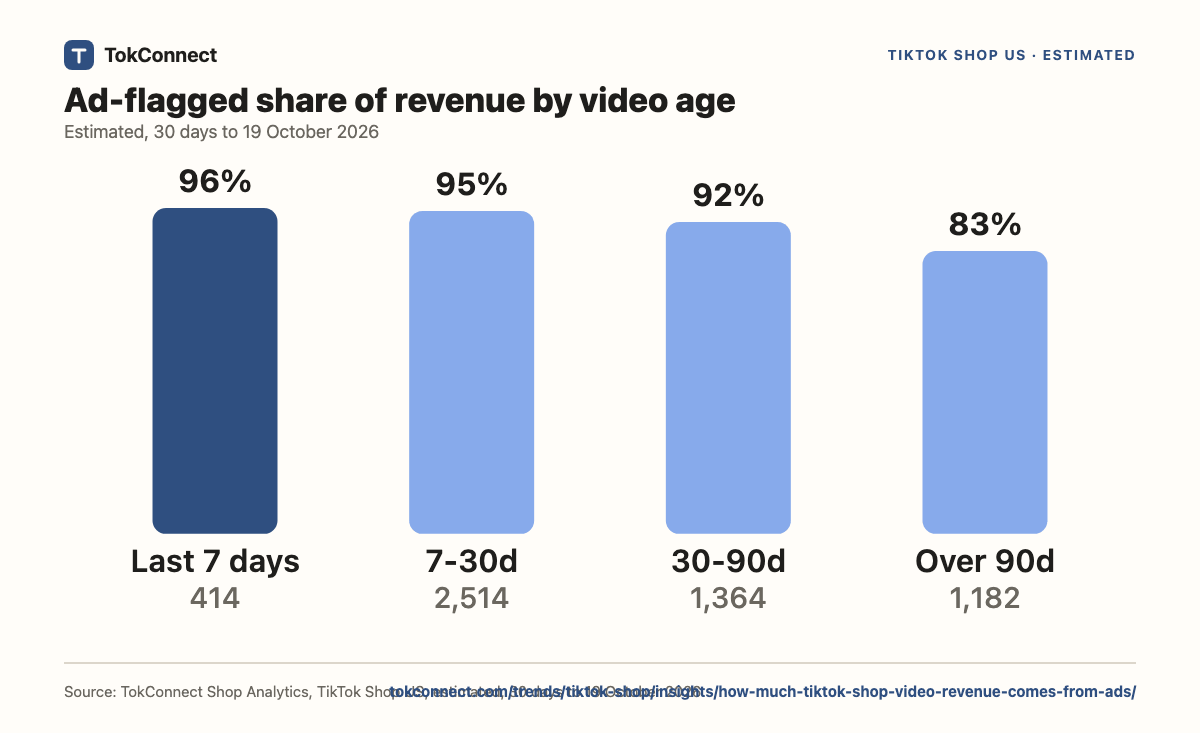
Among videos posted in the last 7 days, 96% of revenue is ad-flagged; among over 90 days old it is 83%.
TokConnect Shop Analytics, TikTok Shop US, estimated, 30 days to 19 October 2026
Show the numbers as a table
| Video age | Videos | Ad-flagged share of videos | Ad-flagged share of revenue |
|---|---|---|---|
| Posted in the last 7 days | 414 | 91.1% | 96.0% |
| 7 to 30 days old | 2,514 | 93.3% | 95.2% |
| 30 to 90 days old | 1,364 | 85.5% | 91.9% |
| Over 90 days old | 1,182 | 69.0% | 83.3% |
What this means
For brands
92% of sampled video revenue is ad-flagged, so plan for ad-supported video alongside commission, not instead of it. The flag shows that a video is run as an ad; the spend is not visible.
For affiliates
Videos with the ad flag earn 92% of the money, so ask a brand whether it runs creator videos as ads, and on what terms, before you agree a rate.
For sellers
Check how much of a competitor's video revenue is ad-flagged before you copy its volume: 39 of 56 sampled products earn 90% or more that way.
What TokConnect adds to this study
This page is one snapshot of one question. TokConnect runs the same Shop Analytics live, for your own niche, brand or product, down to the creator, the video and the LIVE.
- A product's ad shareFor [product link] on TikTok Shop US, show video revenue split between ad-flagged and other videos for the last 30 days.Ask in TokConnect
- Ad share in your nicheWhat share of top-product video revenue in [my category] on TikTok Shop US comes from ad-flagged videos?Ask in TokConnect
- Videos worth boostingList the top 10 TikTok Shop US videos for [product link] by revenue with ad flag, views and length.Ask in TokConnect
- Competitor ad relianceFor [competitor shop] on TikTok Shop US, how much of its video sales comes from ad-flagged videos?Ask in TokConnect
50 free credits, no card, failed calls are free. Works in , , and TokConnect Chat. Try the free TikTok Shop analytics tool or read the TikTok Shop MCP guide.
Questions about this study
How much TikTok Shop video revenue comes from ads?
91.8% of the estimated revenue of the sampled selling videos, $41.52M of $45.24M, in the 30 days to 19 October 2026.
What share of selling videos are ad-flagged?
85.9% of 5,474 videos in a sample of 60 products.
Do ad-flagged videos earn more?
The median ad-flagged video earned $2.8K against $2.1K for other videos; per 1,000 views, $19.40 against $22.04.
What does the ad flag mean?
It is the source's flag that the video is run as an ad. We count the flag and cannot see spend.
How many videos were checked for the ad flag?
5,474 selling videos from 60 products: the 30 biggest by revenue and 30 drawn at random from the rest of the top 1,000.
Method and sources
Estimated from TikTok Shop sold counts and listed prices, 30 days to 19 October 2026. This study uses a sample of selling videos: the 30 biggest products by revenue and 30 products drawn at random, with a fixed seed, from ranks 31 to 1,000 of the product pool, and for each the up to 100 videos with the most estimated revenue in the window. That is 5,474 videos from 60 products. Videos are reduced to numbers (flags, revenue, units, views, length, age); no video, caption or creator is stored. Products come from the product pool, which leaves out rows the source flags as price-suspect. Product-level counts use products with 10 or more selling videos in the sample. A video is ad-flagged when the source marks it as an ad; spend is not visible. Pulled 21 October 2026, data to 19 October 2026. Totals are sums over this sample, not all TikTok Shop video sales. Read the full method and corrections policy. Questions or corrections: dj@tokconnect.com.