Does a higher commission sell more on TikTok Shop?
By DanielUpdated 21 October 2026Data to 19 October 202630 days from 20 SeptemberTikTok Shop US, estimatedHow this is estimated
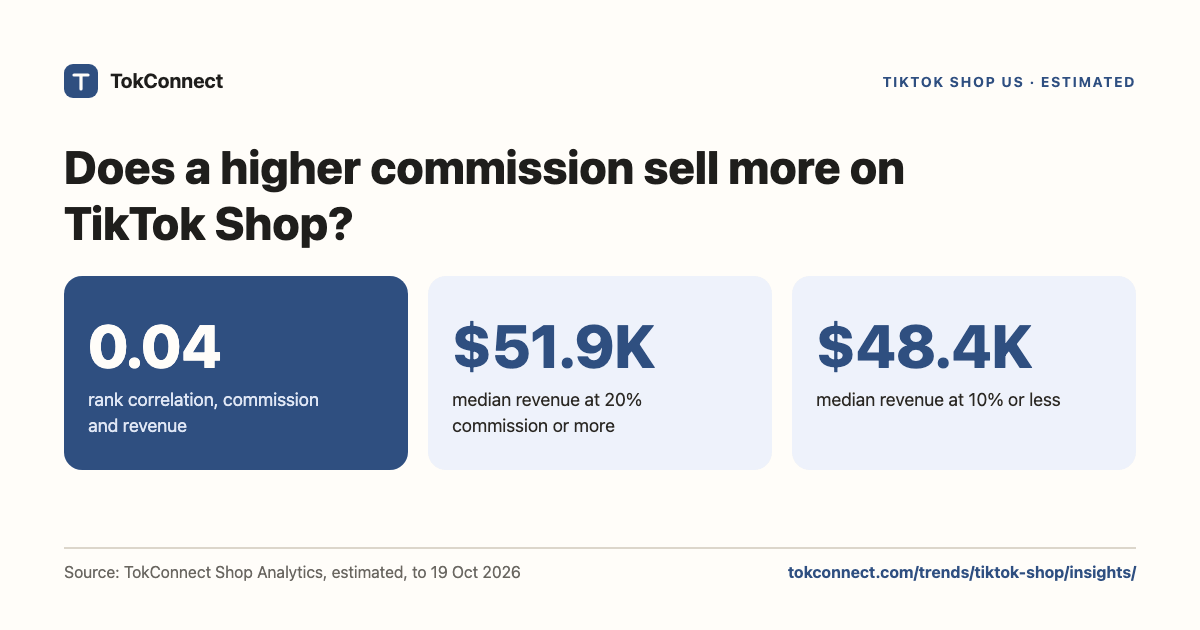
Commission has almost no link with sales: across 9,097 top TikTok Shop US products the rank correlation between commission rate and 30-day revenue is 0.04. The median product paying 20% or more earned $51.9K, against $48.4K for products paying 10% or less (30 days to 19 October 2026).
Key statistics
Free to quote and share with a link to this page. Each figure comes from the data listed under Method and sources.
The rank correlation between commission rate and estimated revenue is 0.04 across 9,097 top TikTok Shop US products (30 days to 19 October 2026).
Median estimated revenue is $51.9K at 20% commission or more and $48.4K at 10% or less (30 days to 19 October 2026).
The median product paying 20% or more has 262 creators, against 139 at 10% or less (30 days to 19 October 2026).
The rank correlation between commission and creator count is 0.22 (30 days to 19 October 2026).
In 3 of the 8 biggest categories, products paying 15% or more have a higher median revenue than products paying under 10% (30 days to 19 October 2026).
Median revenue barely moves with the rate
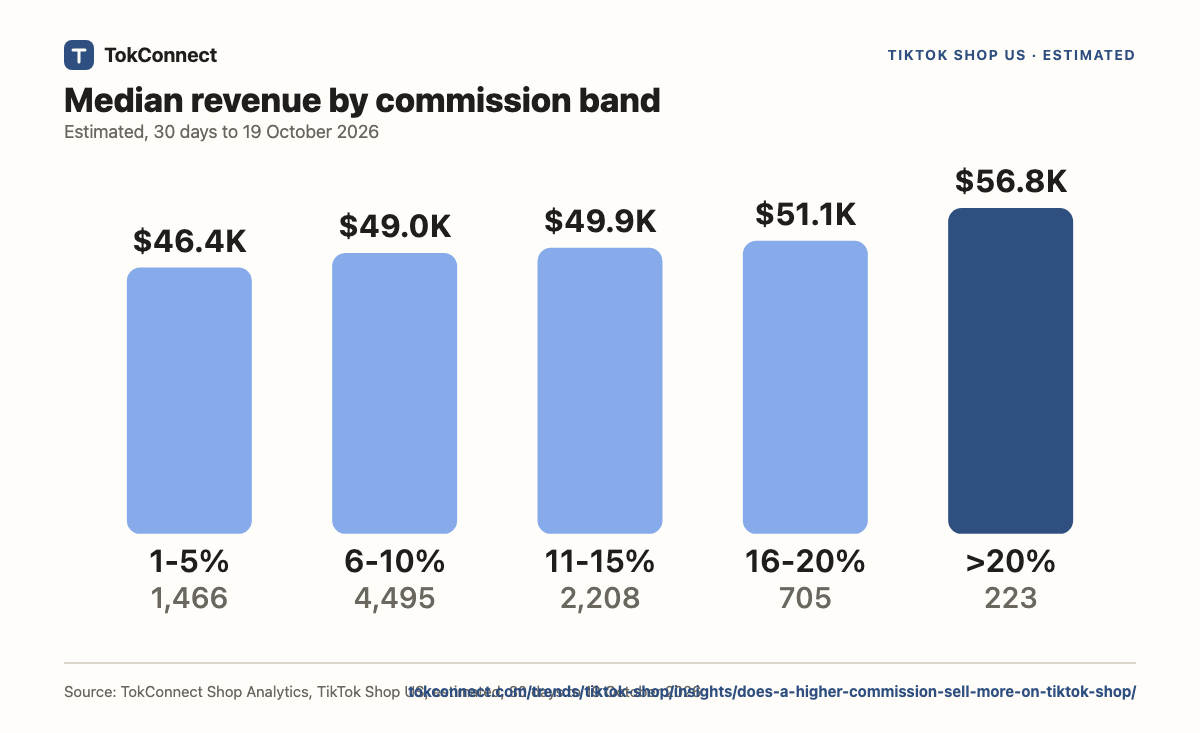
Median revenue is $46.4K for products paying 1% to 5% and $56.8K for products paying over 20%. A higher rate does not mark a better seller.
TokConnect Shop Analytics, TikTok Shop US, estimated, 30 days to 19 October 2026
Show the numbers as a table
| Commission rate | Products | Median revenue | Share at $250K or more |
|---|---|---|---|
| 1% to 5% | 1,466 | $46.4K | 4.4% |
| 6% to 10% | 4,495 | $49.0K | 4.4% |
| 11% to 15% | 2,208 | $49.9K | 5.1% |
| 16% to 20% | 705 | $51.1K | 6.0% |
| Over 20% | 223 | $56.8K | 10.8% |
Go deeper in TokConnectIn [my category] on TikTok Shop US, do the products that pay higher commission earn more? Compare products at 10% or less with products at 15% or more over the last 30 days.
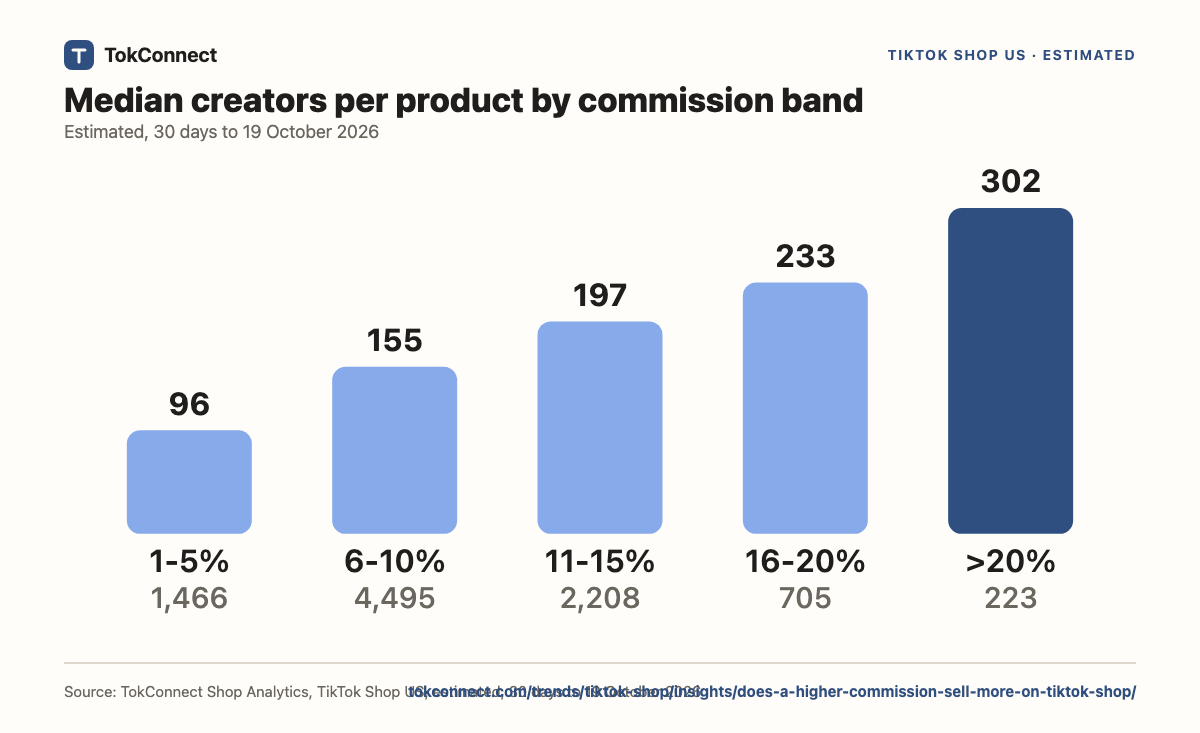
Higher commission does recruit more creators
The median product paying 1% to 5% has 96 creators; at over 20% it has 302.
TokConnect Shop Analytics, TikTok Shop US, estimated, 30 days to 19 October 2026
Show the numbers as a table
| Commission rate | Products | Median creators |
|---|---|---|
| 1% to 5% | 1,466 | 96 |
| 6% to 10% | 4,495 | 155 |
| 11% to 15% | 2,208 | 197 |
| 16% to 20% | 705 | 233 |
| Over 20% | 223 | 302 |
Inside each big category
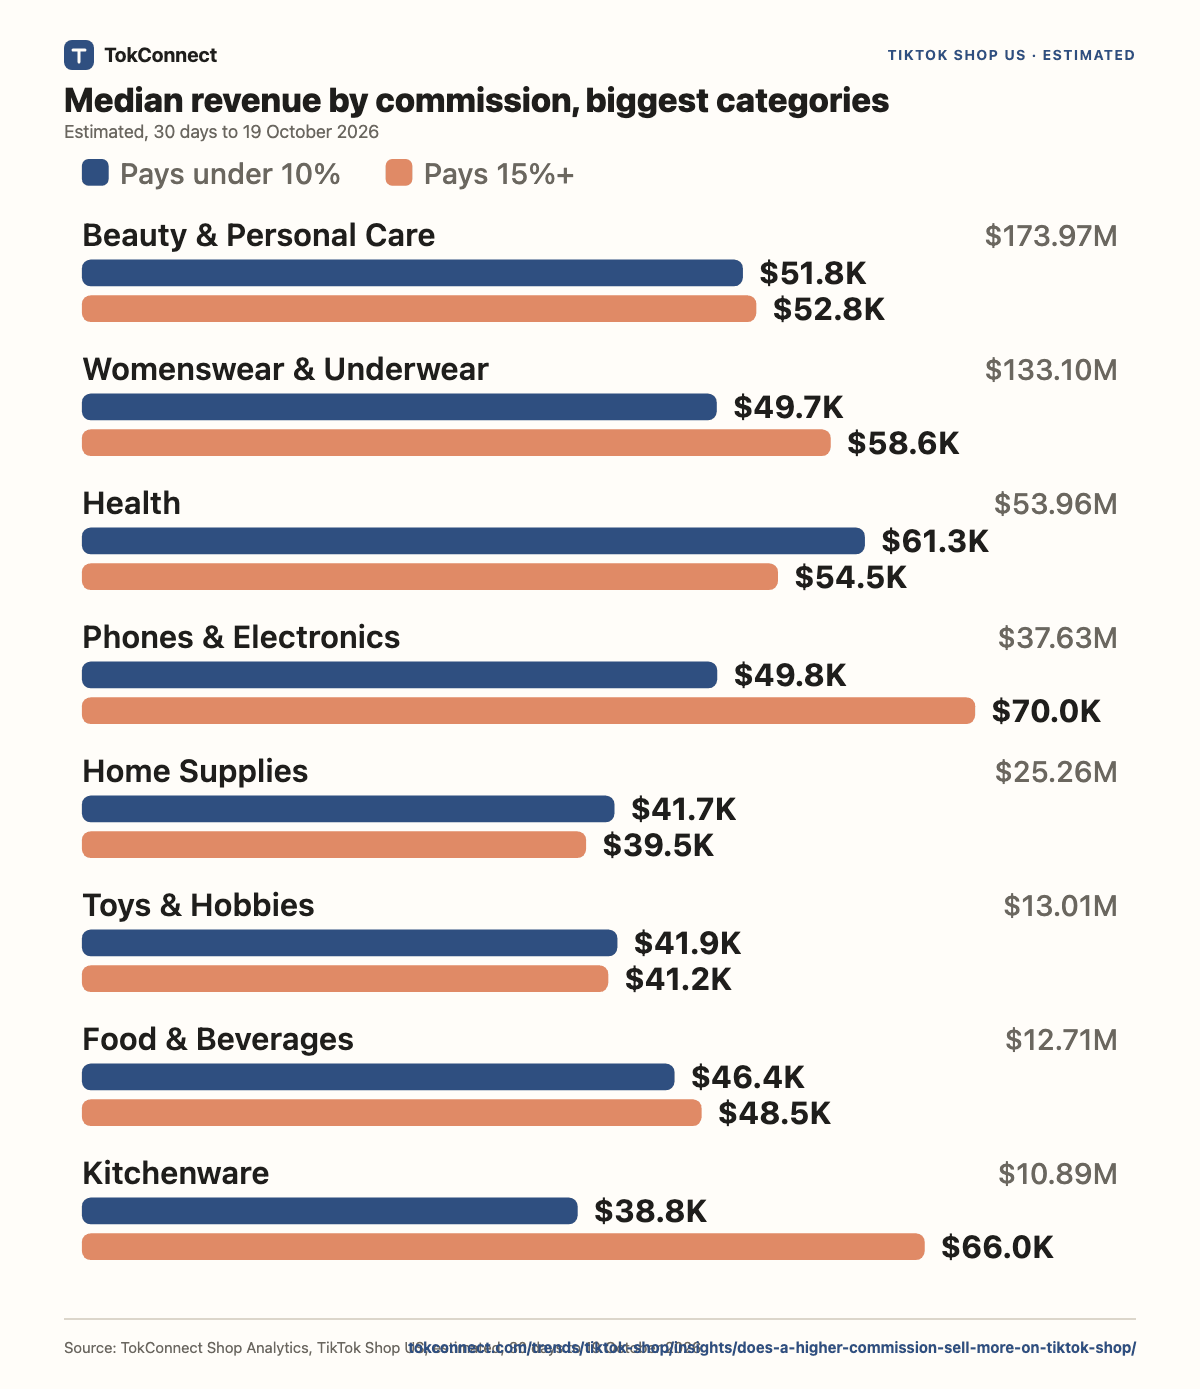
In 3 of the 8 biggest categories, products paying 15% or more beat products paying under 10% on median revenue; in the other 5 they do not.
TokConnect Shop Analytics, TikTok Shop US, estimated, 30 days to 19 October 2026
Show the numbers as a table
| Category | Products under 10% | Median revenue | Products 15% or more | Median revenue |
|---|---|---|---|---|
| Beauty & Personal Care | 362 | $51.8K | 498 | $52.8K |
| Womenswear & Underwear | 1,055 | $49.7K | 47 | $58.6K |
| Health | 40 | $61.3K | 390 | $54.5K |
| Phones & Electronics | 300 | $49.8K | 25 | $70.0K |
| Home Supplies | 187 | $41.7K | 39 | $39.5K |
| Toys & Hobbies | 111 | $41.9K | 24 | $41.2K |
| Food & Beverages | 41 | $46.4K | 62 | $48.5K |
| Kitchenware | 73 | $38.8K | 20 | $66.0K |
What this means
For brands
Raising the rate is a recruiting tool, not a sales guarantee. The data shows almost no link between rate and revenue, so fix the offer, the price and the creative before you give up margin.
For affiliates
Do not choose on rate alone. Products paying 20% or more have a median of 262 creators; products at 10% or less have 139. Check how crowded a product already is before you pitch it.
For sellers
Before you match a competitor's rate, look at your own category: in 3 of 8 large categories the higher-paying products win on median revenue.
What TokConnect adds to this study
This page is one snapshot of one question. TokConnect runs the same Shop Analytics live, for your own niche, brand or product, down to the creator, the video and the LIVE.
- Test it in your categoryFor TikTok Shop US [my category], compare median revenue and creator count for products paying under 10% and over 15% in the last 30 days.Ask in TokConnect
- Products worth pitchingFind TikTok Shop US products in [my category] with commission above 15%, under 100 creators and rising revenue in the last 7 days.Ask in TokConnect
- Open offersWhich TikTok Shop US products in [my category] earn over $50K a month with commission under 8%, and who sells them?Ask in TokConnect
- A product up closeFor the TikTok Shop US product [product link], show commission, creators, revenue trend and the videos that drive its sales.Ask in TokConnect
50 free credits, no card, failed calls are free. Works in , , and TokConnect Chat. Try the free TikTok Shop analytics tool or read the TikTok Shop MCP guide.
Questions about this study
Does a higher commission sell more on TikTok Shop?
Not reliably. The rank correlation between commission and revenue is 0.04 across 9,097 top products, which is almost no link.
Do high-commission products get more creators?
The correlation between commission and creator count is 0.22. The median product paying 20% or more has 262 creators and at 10% or less 139.
What do products paying over 20% earn?
A median of $51.9K in the 30 days to 19 October 2026, against $48.4K for products paying 10% or less.
How is the link measured?
With a rank correlation (Spearman) between each product's listed commission and its estimated 30-day revenue, over products that list a commission. A value near 0 means no link; 1 means a perfect one.
Should I raise my commission to sell more?
Check your category first. In 3 of the 8 biggest categories, products paying 15% or more have higher median revenue; in the rest they do not.
Method and sources
Estimated from TikTok Shop sold counts and listed prices, 30 days to 19 October 2026. The product pool holds 10,764 TikTok Shop US products with at least $25K of estimated revenue in 30 days, gathered with subcategory names, level-3 names and 108 keywords. Products the source flags as price-suspect are dropped, and their revenue is in no figure here. Only products that list a commission are used. Totals are sums over these tracked products, not the size of the market. Pulled 21 October 2026, data to 19 October 2026. Read the full method and corrections policy. Questions or corrections: dj@tokconnect.com.