Video does the selling
91% of revenue, an estimated $1.06M, came from creator videos. LIVE made 4.6%.
30 days to 19 October 2026Source: TikTok Creator Search Insights via TokConnect, 21 October 2026. Search counts are TikTok's figure for the last 7 days; the arrow compares the latest reading with the average of the previous six days. TikTok Shop items: estimated revenue, TikTok Shop US, 30 days to 18 October 2026, growth against the 30 days before.
 tokconnectStart free
By DanielUpdated 21 October 2026Data to 19 October 202630 days from 20 SeptemberTikTok Shop US, estimatedHow this is estimated
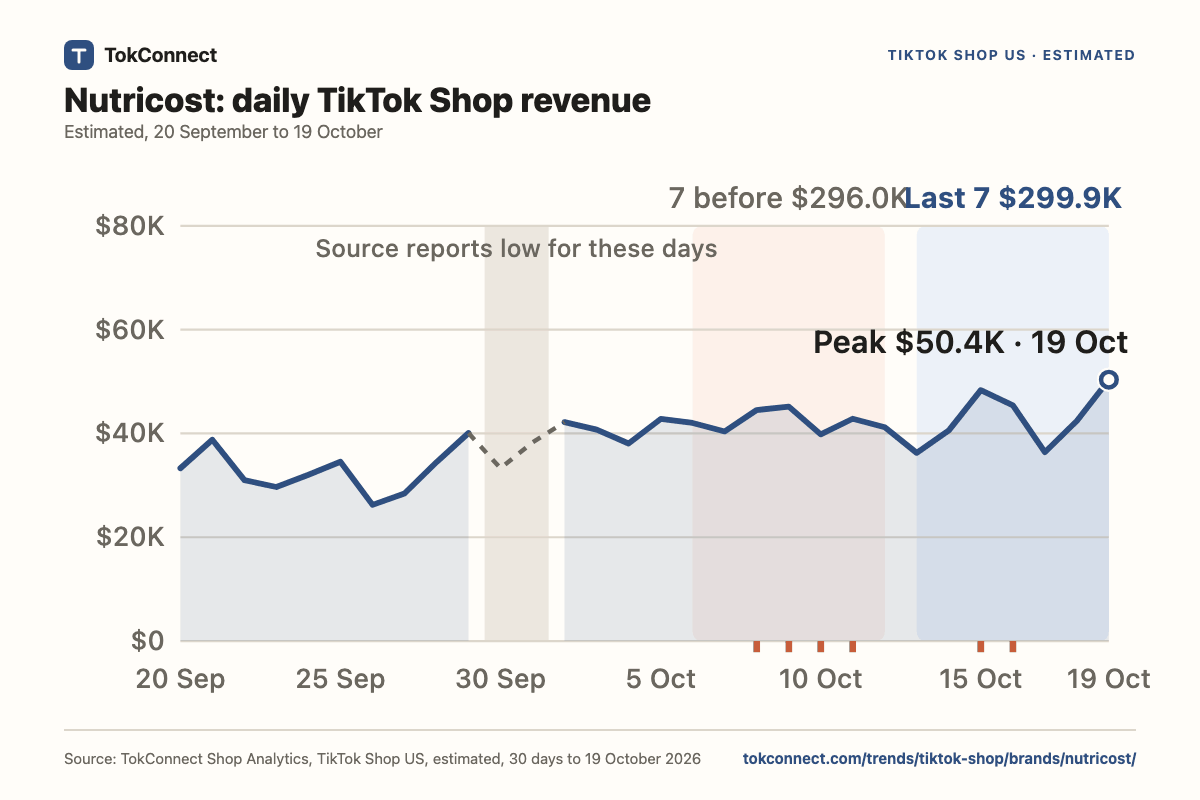
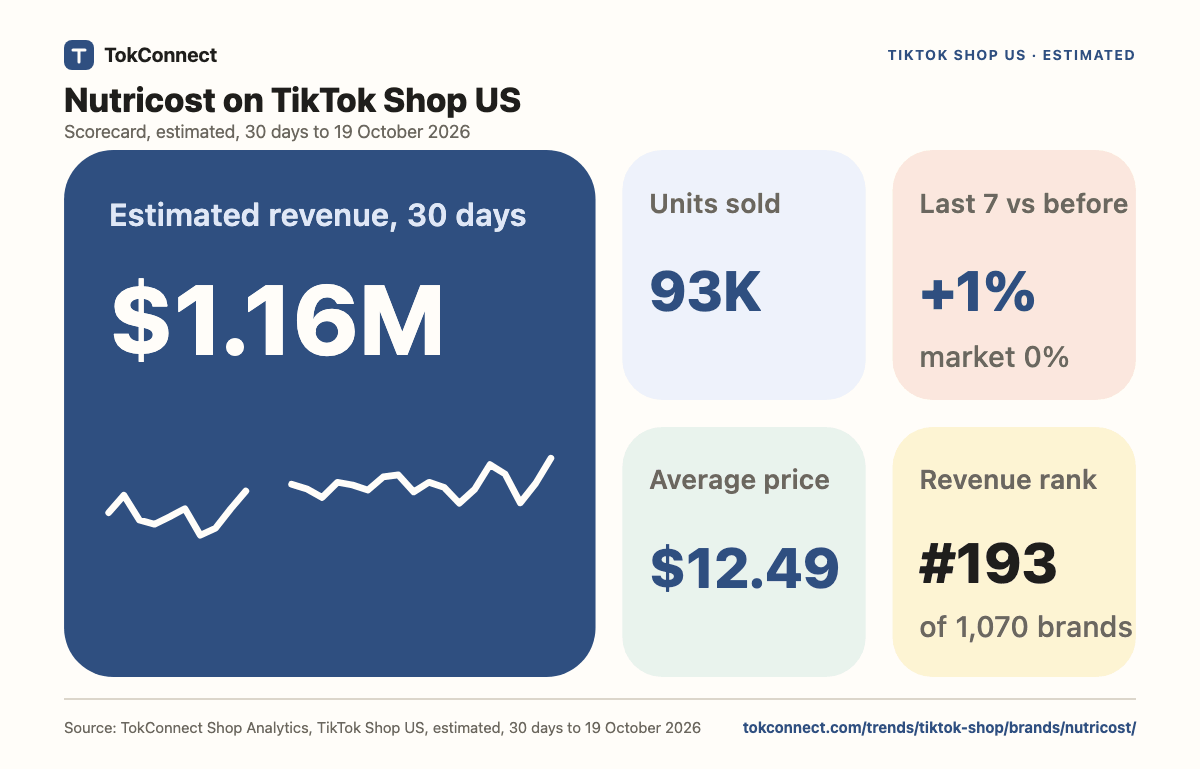
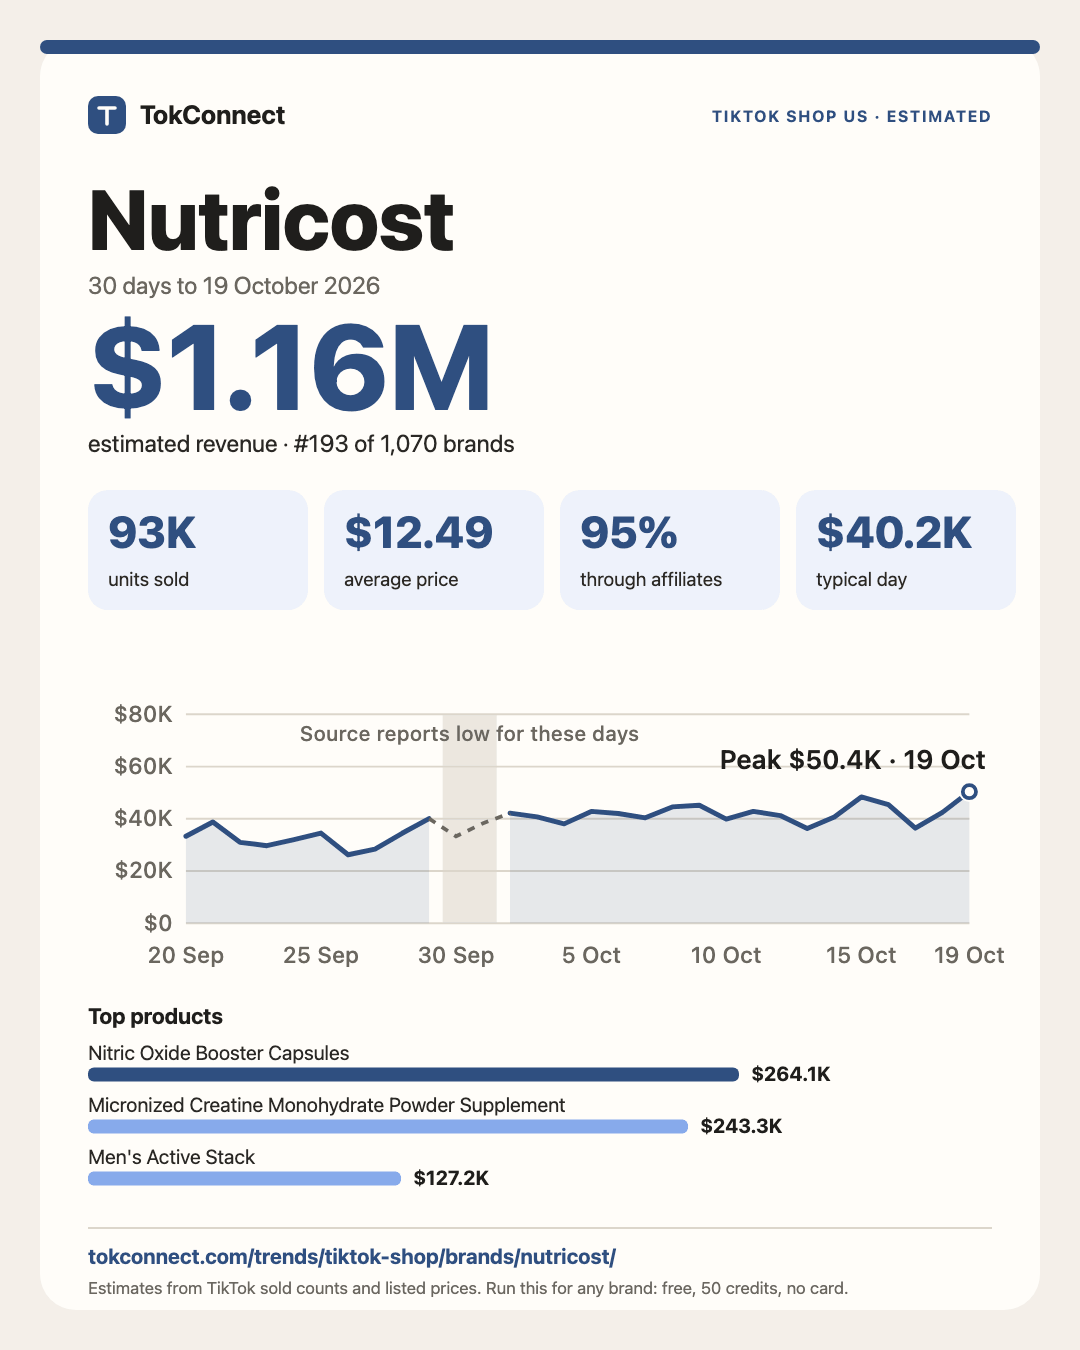
According to TokConnect Shop Analytics, Nutricost sold an estimated $1.16M on TikTok Shop US in the 30 days to 19 October 2026: 93K units at an average price of $12.49. That ranks #193 of 1,070 tracked brands, and #15 of 71 in Health as the source files it. In the last 7 complete days it was up 1% on the 7 before, against level with the same earlier days for the tracked brands.
Revenue for 30 Sep and 1 Oct is reported low across the whole data source, so 30-day totals can read a little low.
Free to quote and share with a link to this page. Each figure comes from the data listed under Method and sources.
Nutricost made an estimated $1.16M on TikTok Shop US in the 30 days to 19 October 2026.
Nutricost sold an estimated 93K units at an average price of $12.49 in the 30 days to 19 October 2026.
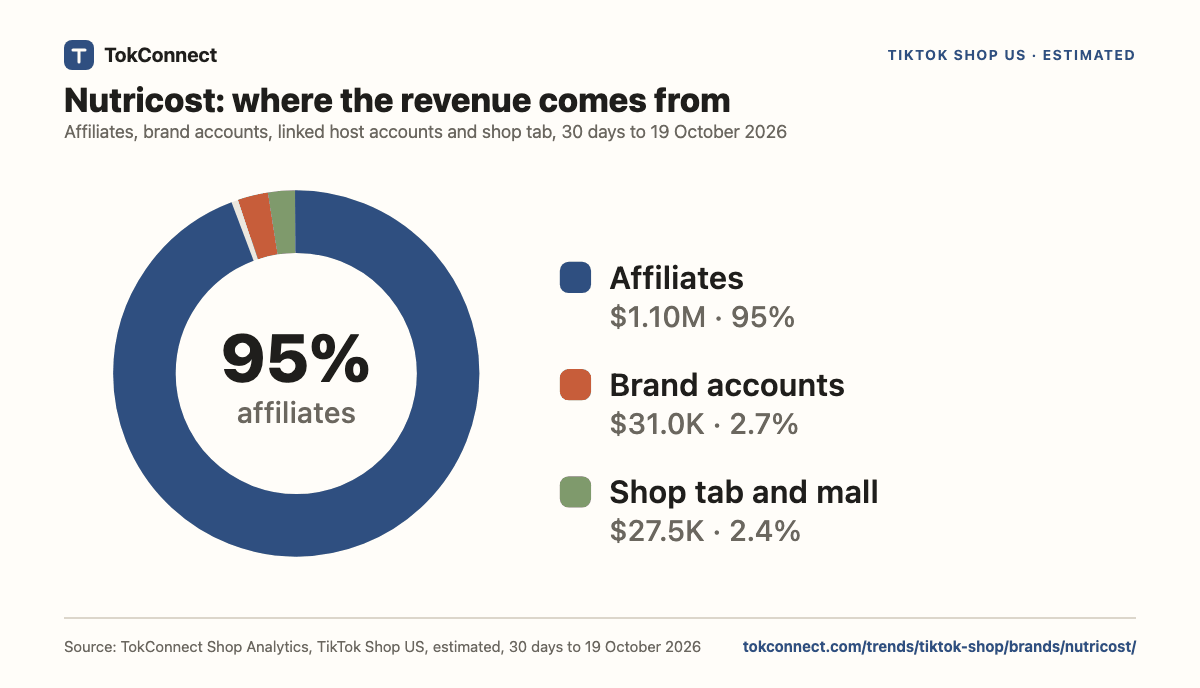
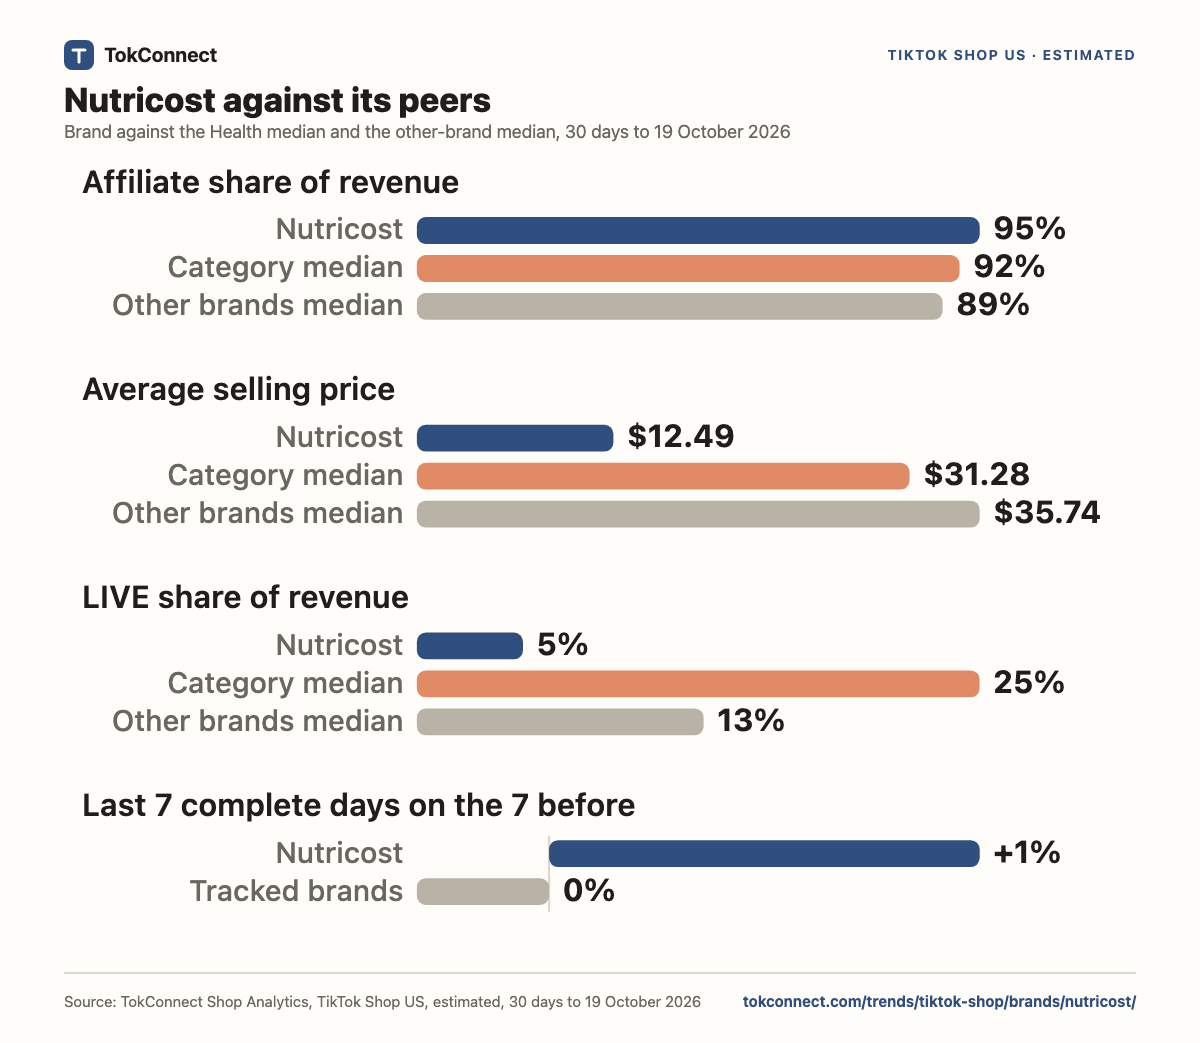
Affiliate creators drove 95% of Nutricost's estimated TikTok Shop source revenue in the 30 days to 19 October 2026; accounts carrying its own name made 2.7%.
Nutricost ranks #193 of 1,070 tracked TikTok Shop brands by estimated revenue in the 30 days to 19 October 2026 and #15 of 71 in Health.
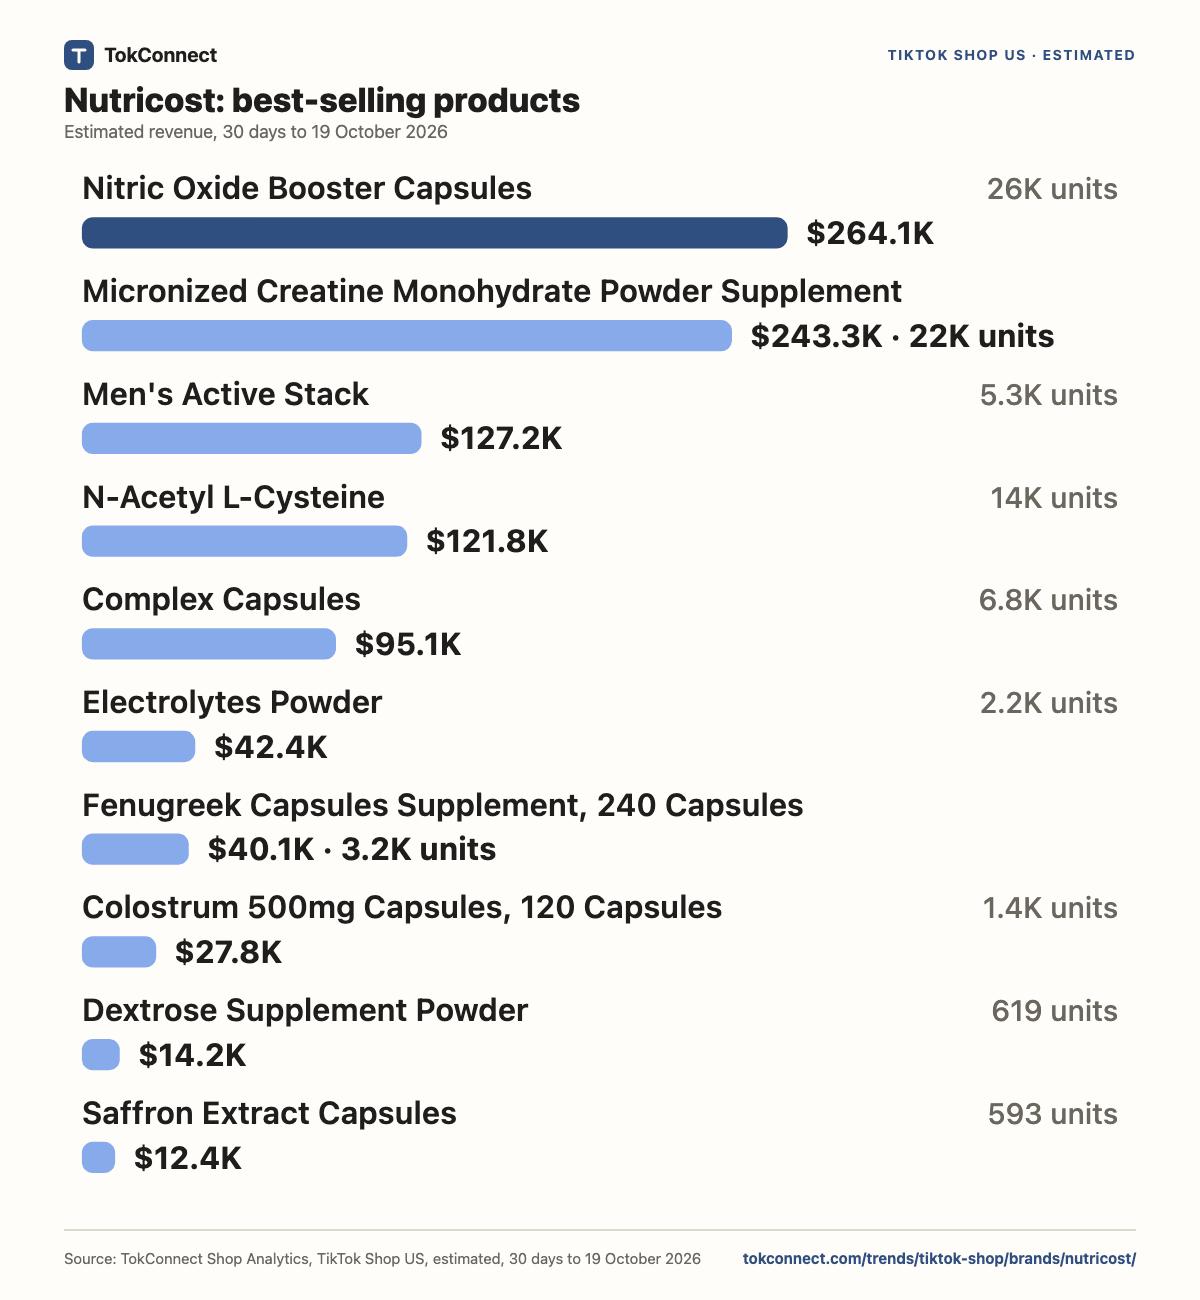
Nitric Oxide Booster Capsules was Nutricost's best-selling listing: an estimated $264.1K, 23% of headline revenue, in the 30 days to 19 October 2026.
Nutricost's last 7 complete days (13 to 19 October) came to $299.9K, up 1% on the 7 days before ($296.0K), while the tracked brands together were unchanged; those days include a platform-wide surge. The difference from the tracked brands is under 20 points, which is too small to call a trend for this brand.
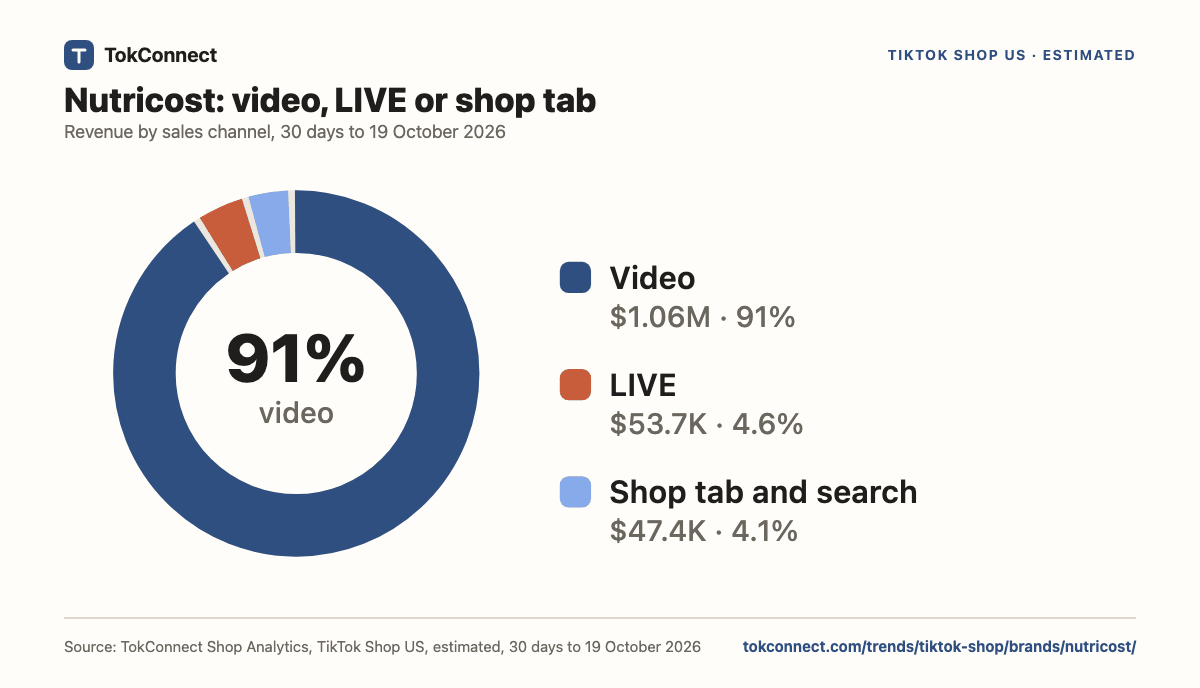
91% of revenue, an estimated $1.06M, came from creator videos. LIVE made 4.6%.
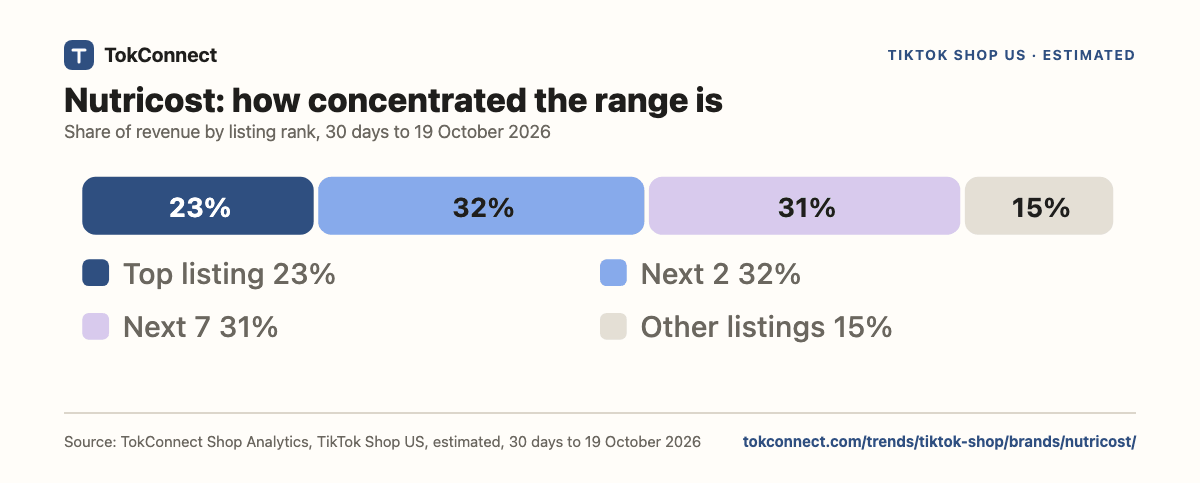
30 days to 19 October 2026Revenue sits with a short list: Nitric Oxide Booster Capsules, Micronized Creatine Monohydrate Powder Supplement and Men's Active Stack together took 55%, or $634.6K.
30 days to 19 October 2026In the 30 days to 19 October 2026, Nutricost is #193 of 1,070 tracked brands by estimated 30-day revenue, and #15 of 71 in Health as the source files it. The leader in Health, Micro Ingredients, made $6.38M. Nutricost holds 1.9% of the revenue of the 71 Health brands tracked.
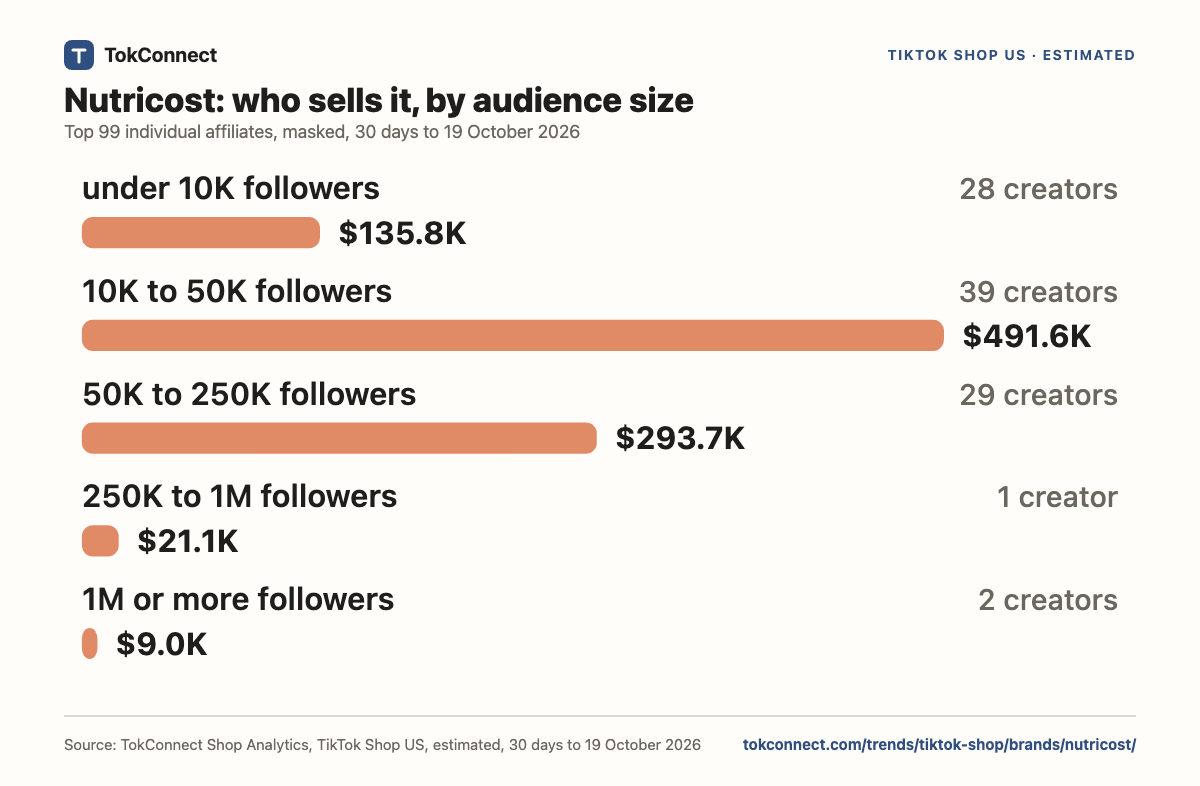
30 days to 19 October 2026The two biggest affiliates, with 10K to 50K followers and 10K to 50K followers, drove an estimated $188.3K, 16% of Nutricost's revenue.
30 days to 19 October 20262 to 12 October: 11 days in a row at $38.1K to $45.2K a day, 42% of the complete days in the window. A typical day made $40.2K.
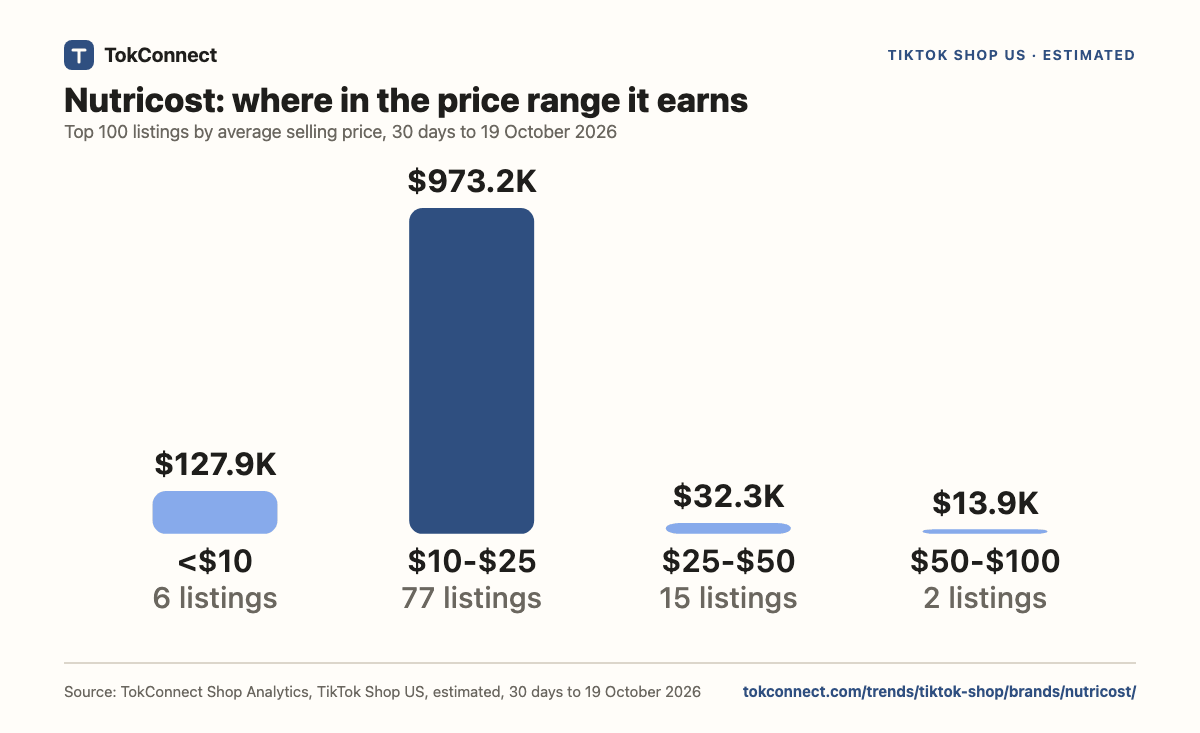
30 days to 19 October 2026Nutricost's average selling price is $12.49, against a median of $31.28 for tracked Health brands.
30 days to 19 October 2026Go deeper in TokConnectWhich Nutricost products grew fastest on TikTok Shop in the last 7 days, and who is selling them?
Nutricost launched in 2012 as a vitamin and supplement company based in Vineyard, Utah. It sells over 650 products, including sports nutrition and children's vitamins.
Its estimated $1.16M for the 30 days to 19 October 2026 places it #193 among 1,070 tracked brands. Nutricost's last 7 complete days (13 to 19 October) came to $299.9K, up 1% on the 7 days before ($296.0K), while the tracked brands together were unchanged; those days include a platform-wide surge. The difference from the tracked brands is under 20 points, which is too small to call a trend for this brand.
This is a low-ticket basket: it took 93K units at $12.49 to reach that total, so creators need many orders to move it. Nitric Oxide Booster Capsules takes 23% and the top three listings take 55% of the 221 listings with sales. The brand's own account made 2.7% against 95% from creators, so an affiliate is joining a programme where creators supply nearly all the volume.
Analyst note based on this page's numbers and the sources listed below, updated 21 October 2026. How these pages are made. Outside facts: pr.com.
TokConnect Shop Analytics, TikTok Shop US, estimated, 30 days to 19 October 2026
| Date | Est. revenue | Est. units | Affiliates | Brand and linked accounts | Shop tab and mall | Day |
|---|---|---|---|---|---|---|
| 20 September | $33.3K | 2,467 | $32.3K | $55 | $881 | complete |
| 21 September | $38.8K | 2,651 | $35.1K | $2.5K | $1.2K | complete |
| 22 September | $31.0K | 2,390 | $29.5K | $112 | $1.4K | complete |
| 23 September | $29.7K | 2,398 | $28.1K | $647 | $906 | complete |
| 24 September | $32.0K | 2,675 | $31.4K | $53 | $609 | complete |
| 25 September | $34.5K | 2,849 | $31.0K | $2.9K | $685 | complete |
| 26 September | $26.2K | 2,138 | $24.8K | $47 | $1.3K | complete |
| 27 September | $28.4K | 2,210 | $26.8K | $191 | $1.4K | complete |
| 28 September | $34.5K | 2,682 | $30.2K | $2.5K | $1.8K | complete |
| 29 September | $40.1K | 3,085 | $37.2K | $2.5K | $337 | complete |
| 30 September | $33.3K | 2,613 | $30.6K | $2.3K | $361 | source reports low |
| 1 October | $38.3K | 3,121 | $37.2K | $193 | $858 | source reports low |
| 2 October | $42.2K | 3,441 | $41.3K | $133 | $747 | complete |
| 3 October | $40.7K | 3,175 | $39.3K | $492 | $960 | complete |
| 4 October | $38.1K | 2,905 | $36.5K | $553 | $977 | complete |
| 5 October | $42.8K | 3,388 | $39.3K | $3.0K | $487 | complete |
| 6 October | $42.0K | 3,342 | $40.7K | $88 | $1.2K | complete |
| 7 October | $40.4K | 3,216 | $37.9K | $2.2K | $341 | complete |
| 8 October | $44.5K | 3,486 | $40.7K | $3.1K | $735 | complete |
| 9 October | $45.2K | 3,623 | $43.7K | $353 | $1.1K | complete |
| 10 October | $39.8K | 3,124 | $38.2K | $430 | $1.2K | complete |
| 11 October | $42.8K | 3,549 | $41.5K | $197 | $1.1K | complete |
| 12 October | $41.2K | 3,395 | $38.6K | $974 | $1.7K | complete |
| 13 October | $36.2K | 3,100 | $35.3K | $314 | $582 | complete |
| 14 October | $40.6K | 3,410 | $38.3K | $1.7K | $563 | complete |
| 15 October | $48.4K | 4,013 | $47.1K | $39 | $1.2K | complete |
| 16 October | $45.4K | 3,809 | $43.3K | $1.7K | $381 | complete |
| 17 October | $36.4K | 3,065 | $35.7K | $34 | $596 | complete |
| 18 October | $42.5K | 3,666 | $41.5K | $24 | $945 | complete |
| 19 October | $50.4K | 3,889 | $47.9K | $1.8K | $688 | complete |
TokConnect Shop Analytics, TikTok Shop US, estimated, 30 days to 19 October 2026
| Source | Est. revenue | Share of source total |
|---|---|---|
| Affiliates | $1.10M | 95.0% |
| Brand accounts | $31.0K | 2.7% |
| Shop tab and mall | $27.5K | 2.4% |
TokConnect Shop Analytics, TikTok Shop US, estimated, 30 days to 19 October 2026
| Channel | Est. revenue | Share of source total |
|---|---|---|
| Video | $1.06M | 91.3% |
| LIVE | $53.7K | 4.6% |
| Shop tab and search | $47.4K | 4.1% |
TokConnect Shop Analytics, TikTok Shop US, estimated, 30 days to 19 October 2026
| # | Product | Est. revenue | Est. units | Avg price | Share of headline revenue |
|---|---|---|---|---|---|
| 1 | Nitric Oxide Booster Capsules | $264.1K | 26K | $10.00 | 22.8% |
| 2 | Micronized Creatine Monohydrate Powder Supplement | $243.3K | 22K | $10.91 | 21.0% |
| 3 | Men's Active Stack | $127.2K | 5.3K | $23.99 | 11.0% |
| 4 | N-Acetyl L-Cysteine | $121.8K | 14K | $8.41 | 10.5% |
| 5 | Complex Capsules | $95.1K | 6.8K | $13.99 | 8.2% |
| 6 | Electrolytes Powder | $42.4K | 2.2K | $19.03 | 3.7% |
| 7 | Fenugreek Capsules Supplement, 240 Capsules | $40.1K | 3.2K | $12.44 | 3.5% |
| 8 | Colostrum 500mg Capsules, 120 Capsules | $27.8K | 1.4K | $20.01 | 2.4% |
| 9 | Dextrose Supplement Powder | $14.2K | 619 | $23.00 | 1.2% |
| 10 | Saffron Extract Capsules | $12.4K | 593 | $20.99 | 1.1% |
TokConnect Shop Analytics, TikTok Shop US, estimated, 30 days to 19 October 2026
| Group | Share of headline revenue |
|---|---|
| Top listing | 22.8% |
| Listings 2 and 3 | 31.9% |
| Listings 4 to 10 | 30.5% |
| Other listings | 14.8% |
TokConnect Shop Analytics, TikTok Shop US, estimated, 30 days to 19 October 2026
| Price band | Listings | Est. revenue | Share of the top listings |
|---|---|---|---|
| Under $10 | 6 | $127.9K | 11.1% |
| $10 to $25 | 77 | $973.2K | 84.8% |
| $25 to $50 | 15 | $32.3K | 2.8% |
| $50 to $100 | 2 | $13.9K | 1.2% |
TokConnect Shop Analytics, TikTok Shop US, estimated, 30 days to 19 October 2026
| Measure | Group | Value |
|---|---|---|
| Affiliate share of revenue | Nutricost | 95% |
| Affiliate share of revenue | Category median | 92% |
| Affiliate share of revenue | Other brands median | 89% |
| Average selling price | Nutricost | $12.49 |
| Average selling price | Category median | $31.28 |
| Average selling price | Other brands median | $35.74 |
| LIVE share of revenue | Nutricost | 5% |
| LIVE share of revenue | Category median | 25% |
| LIVE share of revenue | Other brands median | 13% |
| Last 7 complete days on the 7 before | Nutricost | +1% |
| Last 7 complete days on the 7 before | Tracked brands | 0% |
TokConnect Shop Analytics, TikTok Shop US, estimated, 30 days to 19 October 2026
| Follower band | Creators | Est. revenue driven | Share |
|---|---|---|---|
| under 10K | 28 | $135.8K | 14.3% |
| 10K to 50K | 39 | $491.6K | 51.7% |
| 50K to 250K | 29 | $293.7K | 30.9% |
| 250K to 1M | 1 | $21.1K | 2.2% |
| 1M or more | 2 | $9.0K | 0.9% |
Go deeper in TokConnectWhich videos and LIVE streams drove Nutricost's TikTok Shop sales in the last 7 days? Show views, revenue and whether they are ads.
Ranked by estimated revenue in the 30 days to 19 October 2026. Commission is the public affiliate rate where the source lists one. Listed is the listing date TikTok shows.
| # | Product | Est. revenue | Est. units | Avg price | Commission | Listed |
|---|---|---|---|---|---|---|
| 1 | Nitric Oxide Booster Capsules22.8% of revenue | $264.1K | 26K | $10.00 | – | 5 Aug 2025 |
| 2 | Micronized Creatine Monohydrate Powder Supplement21.0% of revenue | $243.3K | 22K | $10.91 | – | 18 Feb 2024 |
| 3 | Men's Active Stack11.0% of revenue | $127.2K | 5.3K | $23.99 | 17% | 14 Aug 2026 |
| 4 | N-Acetyl L-Cysteine10.5% of revenue | $121.8K | 14K | $8.41 | – | 12 Mar 2024 |
| 5 | Complex Capsules8.2% of revenue | $95.1K | 6.8K | $13.99 | 21% | 15 May 2026 |
| 6 | Electrolytes Powder3.7% of revenue | $42.4K | 2.2K | $19.03 | – | 24 Jul 2025 |
| 7 | Fenugreek Capsules Supplement, 240 Capsules3.5% of revenue | $40.1K | 3.2K | $12.44 | – | 5 Mar 2024 |
| 8 | Colostrum 500mg Capsules, 120 Capsules2.4% of revenue | $27.8K | 1.4K | $20.01 | – | 5 Mar 2024 |
| 9 | Dextrose Supplement Powder1.2% of revenue | $14.2K | 619 | $23.00 | – | 10 Sep 2024 |
| 10 | Saffron Extract Capsules1.1% of revenue | $12.4K | 593 | $20.99 | – | 3 Aug 2025 |
| 11 | Whey Protein Concentrate Powder1.1% of revenue | $12.2K | 240 | $51.00 | – | 29 Jun 2024 |
| 12 | Magnesium Glycinate 210MG1.0% of revenue | $11.8K | 1.1K | $10.94 | – | 12 Feb 2025 |
| 13 | Pre-Workout Complex0.7% of revenue | $8.6K | 381 | $22.60 | – | 2 Feb 2026 |
| 14 | Hydration Bundle0.7% of revenue | $8.6K | 210 | $40.71 | – | 23 Sep 2026 |
| 15 | Betaine Anhydrous (Capsules Supplement)0.7% of revenue | $7.8K | 714 | $10.99 | – | 12 Mar 2024 |
2 listings ($35, 0.0% of the source total) are priced unreliably by the source and stay out of the product tables. They are left out of this table and the product charts.
Go deeper in TokConnectWhich creators sell Nitric Oxide Booster Capsules from Nutricost on TikTok Shop, and how much did each one drive in the last 30 days?
Accounts on TikTok that carry the brand's own name, with the revenue each sold in the window.
| Account | Followers | Est. revenue | From LIVE | Est. units |
|---|---|---|---|---|
| Nutricost@nutricostofficial | 118K | $31.0K | 78% | 1.6K |
Only accounts whose name or handle is the brand's own name are shown.
A page can only show a snapshot. Ask TokConnect and it runs the same Shop Analytics for Nutricost live, down to the creator, the video and the LIVE.
50 free credits, no card, failed calls are free. Works in , , and TokConnect Chat. Try the free TikTok Shop analytics tool or read the TikTok Shop MCP guide.
An estimated $1.16M of sales over the 30 days to 19 October 2026. Nutricost ranks #193 of 1,070 tracked brands, selling through 1 US storefront.
$1.16M of estimated revenue and about 93K units over the 30 days to 19 October 2026; a typical sale was $12.49.
Nitric Oxide Booster Capsules sits on top with an estimated $264.1K in the 30 days to 19 October 2026, 26K units at $10.00. Behind it come Micronized Creatine Monohydrate Powder Supplement at $243.3K and Men's Active Stack at $127.2K.
Mostly. Affiliate creators drove 95% of Nutricost's estimated source revenue ($1.10M) in the 30 days to 19 October 2026. Accounts carrying the brand's own name made 2.7% ($31.0K), other linked accounts 0% and the shop tab and mall 2.4% ($27.5K).
Nutricost's last 7 complete days (13 to 19 October) came to $299.9K, up 1% on the 7 days before ($296.0K), while the tracked brands together were unchanged; those days include a platform-wide surge. The difference from the tracked brands is under 20 points, which is too small to call a trend for this brand.
TokConnect Shop Analytics estimates units from TikTok's sold counter and revenue as units times the listed price, for the 30 days to 19 October 2026. They are estimates, not Nutricost's own accounts. How this is estimated.
Estimated from TikTok Shop sold counts and listed prices, 30 days to 19 October 2026. Source: TokConnect Shop Analytics, TikTok Shop US. Units follow TikTok's sold counter and revenue is units times the listed price, so every figure here is an estimate, not Nutricost's own accounts. Pulled on 21 October 2026; the last complete day of data is 19 October 2026. Revenue for 30 Sep and 1 Oct is reported low across the whole data source, so 30-day totals can read a little low. Those days are left out of every peak, growth and typical-day figure and are not estimated. 2 listings ($35, 0.0% of the source total) are priced unreliably by the source and stay out of the product tables. The price check matched 100% of the revenue of the top 100 listings to the source's own flag. Product tables and price bands cover the top 100 listings, 99% of headline revenue; the source counts 221 listings with sales. Ranks and medians compare Nutricost with the 1,070 brands the source tracks at $250K or more in 30 days. Individual affiliate creators are never named; only accounts carrying the brand's own name are. Read the full method and corrections policy. Questions or corrections: dj@tokconnect.com.