
Data studyTikTok Shop USEdition 1 · October 2026
TikTok Shop revenue and sales: the US report for October 2026
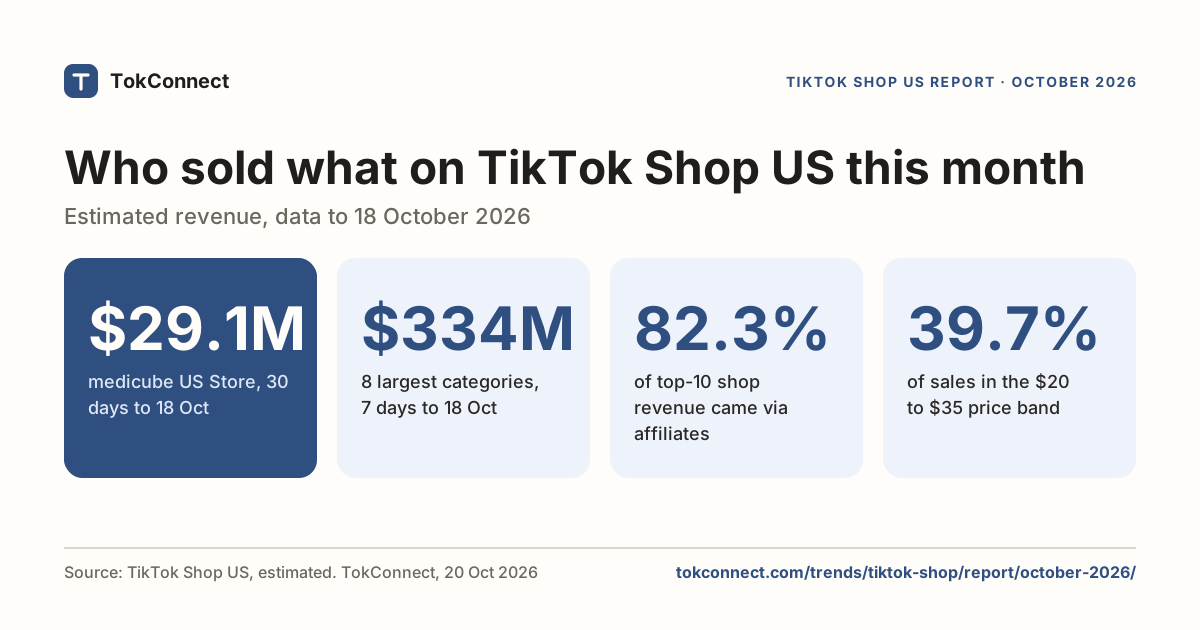
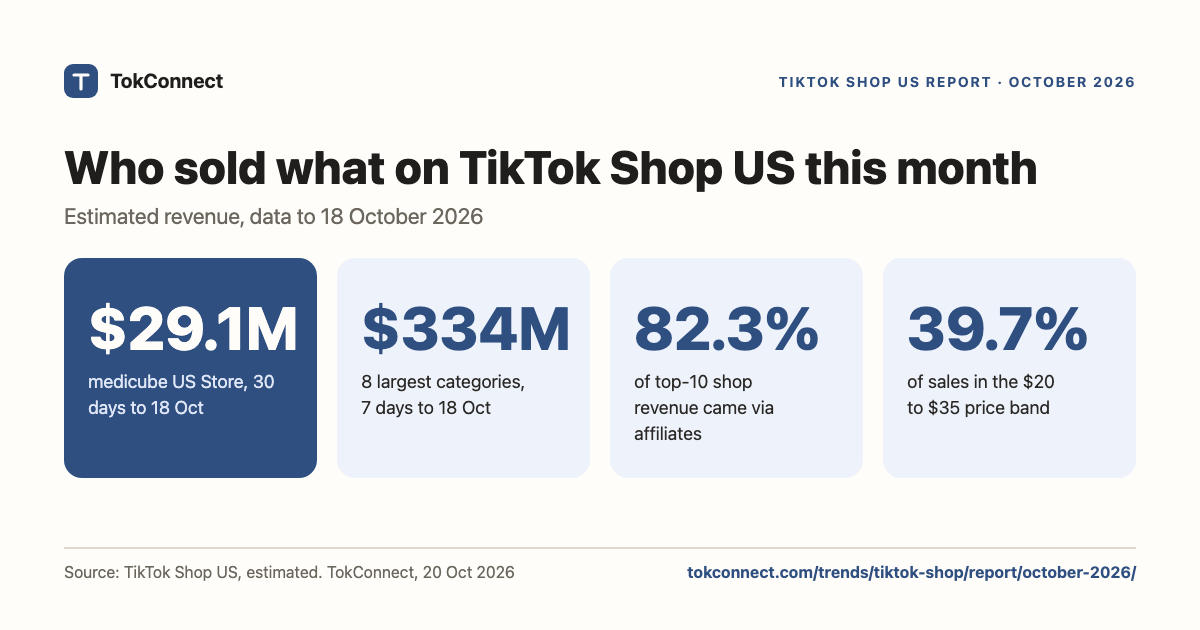
Here is TikTok Shop revenue in the US this month: the eight largest categories sold an estimated $333.6 million in the 7 days to 18 October 2026, up 10.4% on the week before, and the top shop, medicube US Store, sold an estimated $29.1 million in the 30 days to 18 October. TokConnect pulled every figure in this report from its Shop Analytics feed on 20 October 2026, and the full dataset is free to download.
50 free credits, no card. Works in ChatGPT, Claude and TokConnect Chat.
At a glance
- $333.6M
- sold by the eight largest TikTok Shop US categories in the 7 days to 18 October, up 10.4% on the week before
- $29.1M
- sold by medicube US Store in 30 days, 25.8% of the top 10 shops' combined $112.6M
- 77.2%
- of category revenue came through affiliate creators; sellers' own accounts drove 10.4%
- 39.7%
- of top-seller revenue in 10 everyday searches came from products priced $20 to $35
Key statistics
Free to quote and share with a link to this page. Each figure comes from the data listed under Sources and data.
The eight largest TikTok Shop US categories sold an estimated $333.6 million in the 7 days to 18 October 2026, up 10.4% on the previous 7 days.
medicube US Store sold an estimated $29.1 million on TikTok Shop US in the 30 days to 18 October 2026, the most of any shop on the feed's 13 to 18 October leaderboard.
Products priced $20 to $35 made 39.7% of estimated revenue among 829 top-selling TikTok Shop US products in 10 everyday searches in the 30 days to 18 October 2026.
Categories
TikTok Shop revenue by category
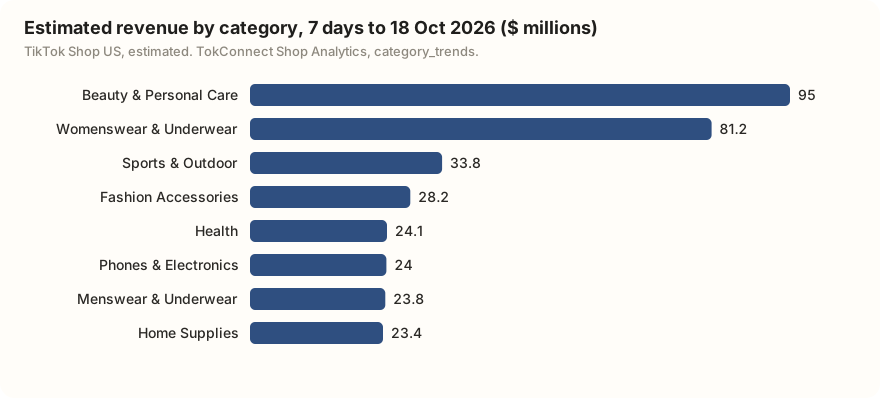
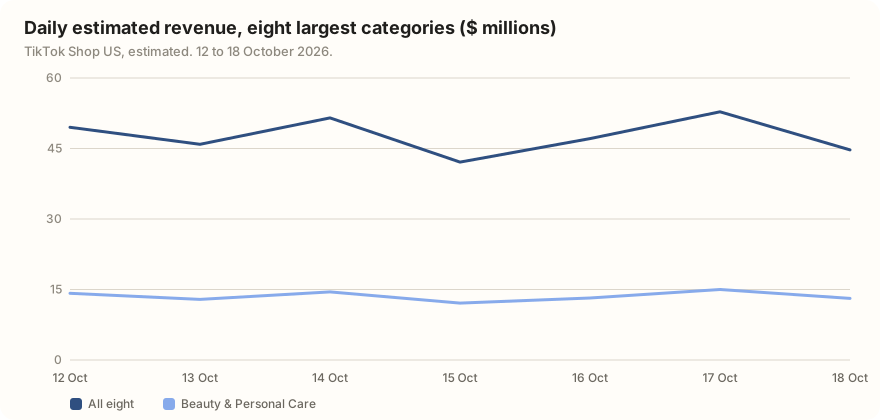
Beauty & Personal Care led TikTok Shop US with an estimated $95.0 million in the 7 days to 18 October 2026, and Womenswear & Underwear followed at $81.2 million. Together they made 52.8% of the eight largest categories' sales. Every one of the eight grew on the week before except Health, which was flat at -0.1%. Menswear & Underwear grew fastest, up 24.9%, and Sports & Outdoor rose 16.0%.
| Category | 7-day revenue | vs week before | Shops selling | Revenue per shop | Top 10 shops' share | LIVE share | Affiliate share |
|---|---|---|---|---|---|---|---|
| Beauty & Personal Care | $95.0M | +9.4% | 16,014 | $6K | 21.6% | 17.8% | 82.4% |
| Womenswear & Underwear | $81.2M | +11.7% | 14,103 | $6K | 18.9% | 11.1% | 81.0% |
| Sports & Outdoor | $33.8M | +16.0% | 12,867 | $3K | 18.3% | 13.6% | 75.4% |
| Fashion Accessories | $28.2M | +6.3% | 12,909 | $2K | 13.7% | 10.2% | 60.2% |
| Health | $24.1M | -0.1% | 3,729 | $6K | 25.3% | 24.0% | 81.3% |
| Phones & Electronics | $24.0M | +8.3% | 8,895 | $3K | 14.1% | 18.0% | 74.0% |
| Menswear & Underwear | $23.8M | +24.9% | 7,731 | $3K | 17.0% | 4.8% | 70.5% |
| Home Supplies | $23.4M | +8.9% | 18,406 | $1K | 10.2% | 15.5% | 71.7% |
TikTok Shop US, estimated. 7 days to 18 October 2026 (12 to 18 October), against the 7 days before. Source: TokConnect Shop Analytics, category_trends level 1.
Two sub-categories were big enough to appear in the feed's level-2 table: Women's Tops at $26.3M (up 19.9%) and Nutrition & Wellness at $22.7M (up 0.9%). Health has the fewest shops of the eight, 3,729, and the highest revenue per shop, $6K.
Shops
The top TikTok Shop US shops, measured over 30 days
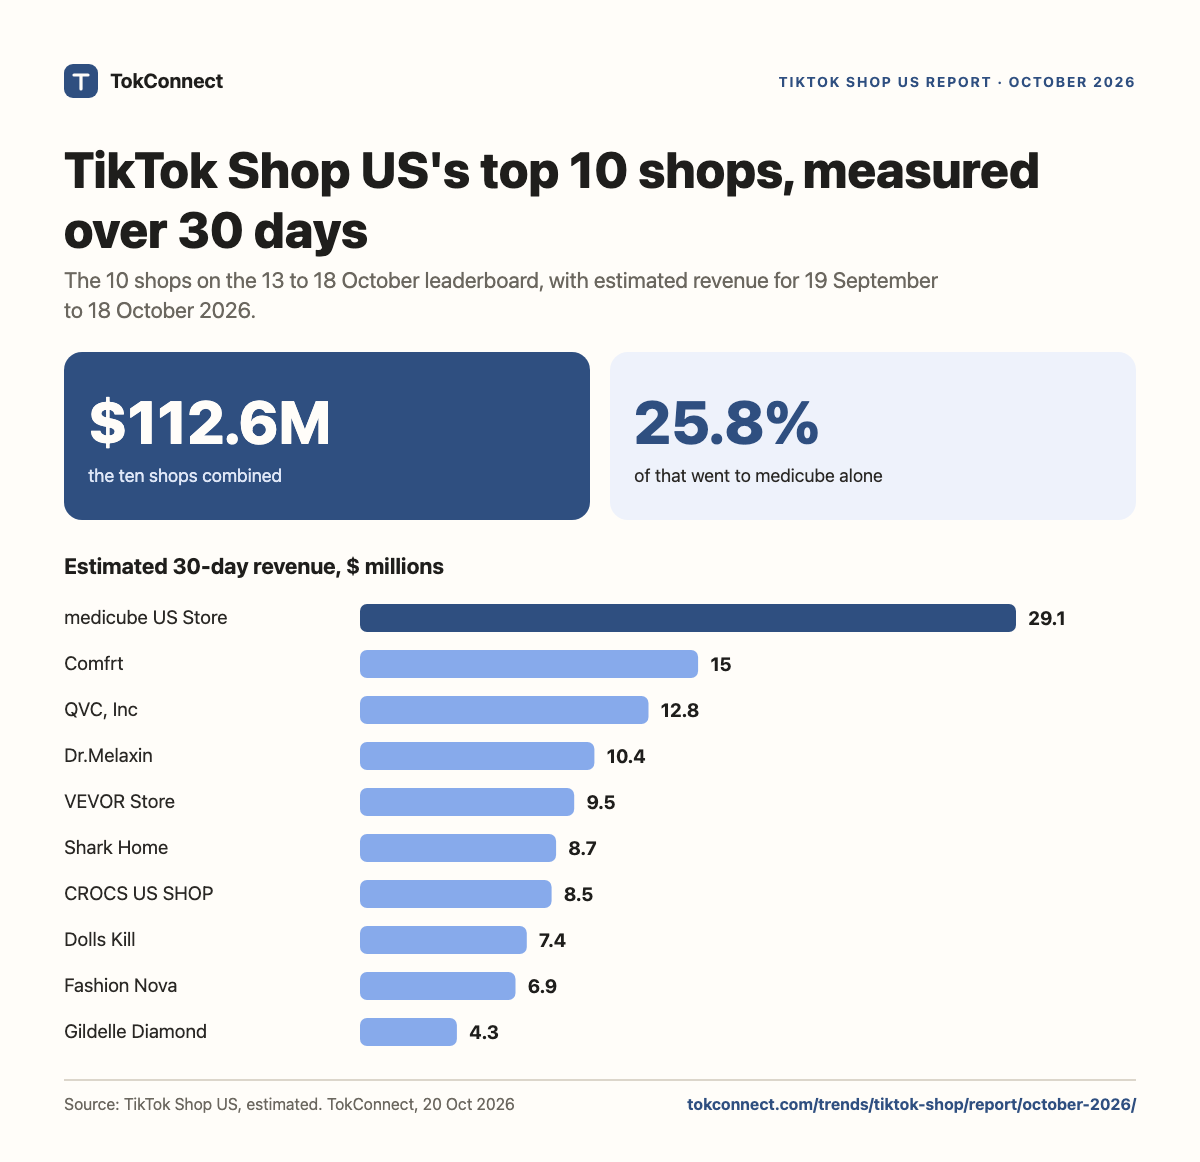
medicube US Store sold an estimated $29.1 million in the 30 days to 18 October 2026, about twice Comfrt's $15.0 million. QVC, Inc came third at $12.8 million. The ten shops below made $112.6 million together, and medicube alone took 25.8% of that.
The list is the feed's own top 10 for 13 to 18 October. We then measured each shop over the full 30 days with shop method sales, so the ranking order below is by 30-day revenue.
| # | Shop | 30-day revenue | Units | Avg price | Affiliates | Own accounts | Shop mall | LIVE share |
|---|---|---|---|---|---|---|---|---|
| 1 | medicube US Store | $29.1M | 864.99k | $33.64 | 84.8% | 3.2% | 12.0% | 13.6% |
| 2 | Comfrt | $15.0M | 352.56k | $42.48 | 88.9% | 10.8% | 0.3% | 15.4% |
| 3 | QVC, Inc | $12.8M | 228.83k | $56.04 | 77.8% | 9.0% | 13.2% | 20.3% |
| 4 | Dr.Melaxin | $10.4M | 402.92k | $25.87 | 94.1% | 4.9% | 1.0% | 16.5% |
| 5 | VEVOR Store | $9.5M | 139.27k | $68.16 | 73.8% | 8.2% | 18.0% | 15.2% |
| 6 | Shark Home | $8.7M | 48.49k | $178.70 | 91.2% | 2.4% | 6.4% | 12.4% |
| 7 | CROCS US SHOP | $8.5M | 183.04k | $46.44 | 88.8% | 11.0% | 0.2% | 25.7% |
| 8 | Dolls Kill | $7.4M | 83.1k | $89.06 | 81.0% | 17.1% | 1.8% | 15.9% |
| 9 | Fashion Nova | $6.9M | 237.3k | $29.08 | 93.8% | 0.0% | 6.2% | 9.6% |
| 10 | Gildelle Diamond | $4.3M | 6.78k | $636.83 | 0.0% | 0.0% | 100.0% | 0.0% |
TikTok Shop US, estimated. 30 days to 18 October 2026 (19 September to 18 October). Shops from the 13 to 18 October leaderboard. Data.
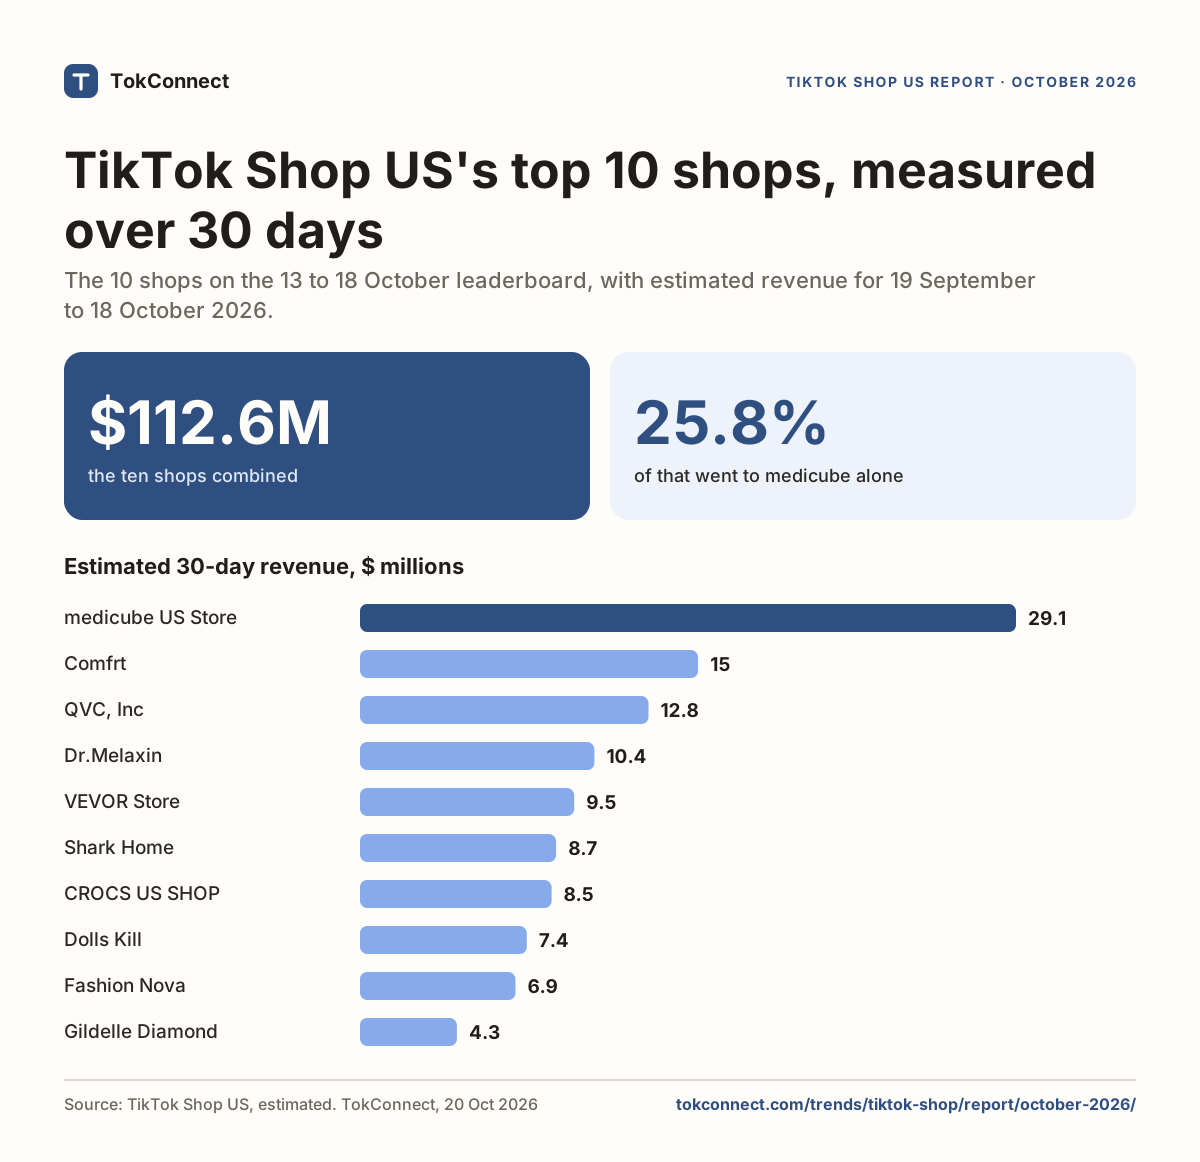
One shop sells differently. Gildelle Diamond made all of its $4.3M through the Shop mall, at an average of $636.83 a unit, with no affiliate or LIVE revenue. Every other shop in the ten made at least 73.8% of its sales through affiliates.
Brands, products and affiliates
Top brands, products and affiliates on TikTok Shop US
Top brands
medicube was also the top brand, at an estimated $7.0 million for 13 to 18 October, ahead of VEVOR ($3.7 million) and Comfrt ($3.2 million). Shark Home holds 16.48% of its main category, Household Appliances, and VEVOR 17.60% of Tools & Hardware: the two most dominant brands in the list.
| # | Brand | Revenue | Units | Main category | Share of category | Creators selling |
|---|---|---|---|---|---|---|
| 1 | medicube | $7.0M | 237.8k | Beauty & Personal Care | 8.48% | 7.06k |
| 2 | VEVOR | $3.6M | 53.62k | Tools & Hardware | 17.60% | 3.46k |
| 3 | comfrt | $3.2M | 77k | Womenswear & Underwear | 3.03% | 2.9k |
| 4 | drmelaxin | $2.7M | 107.53k | Beauty & Personal Care | 3.25% | 3.74k |
| 5 | Shark Home | $2.2M | 11.61k | Household Appliances | 16.48% | 375 |
| 6 | Halara | $2.0M | 60.03k | Sports & Outdoor | 5.18% | 2.14k |
| 7 | Crocs | $1.9M | 39.95k | Shoes | 10.51% | 1.5k |
| 8 | DOLLS KILL | $1.8M | 22.59k | Womenswear & Underwear | 2.34% | 902 |
| 9 | tarte cosmetics | $1.6M | 46.62k | Beauty & Personal Care | 1.90% | 2.17k |
| 10 | SEESE | $1.5M | 48.6k | Tools & Hardware | 5.77% | 1.07k |
TikTok Shop US, estimated. TokConnect Shop Analytics leaderboard for 13 to 18 October 2026. Source: shop_top_selling type brands.
Top products
The best-selling product was medicube's Smooth & Clear Body Care Set at $31, with an estimated $6.9M over 30 days and 2,729 creators promoting it. Seven of the top 10 products sit in Beauty & Personal Care. The second, a $99 press-on nail listing, sold through only 5 creators and made 70.3% of its 30-day revenue on LIVE.
| # | Product | Revenue, 13 to 18 Oct | Revenue, 30 days | Avg price | Creators | LIVE share, 30 days |
|---|---|---|---|---|---|---|
| 1 | [medicube] Smooth & Clear Body Care Set | $1.5M | $6.9M | $31.00 | 2,729 | 2.5% |
| 2 | Handmade Press On Nails, Reusable False Nail Tips | $1.1M | $1.3M | $99.00 | 5 | 70.3% |
| 3 | Shark Glossi Blow Dryer Brush | $731K | $1.9M | $119.00 | 354 | 1.9% |
| 4 | GOPURE Tighten & Smooth Belly Firming Cream | $646K | $862K | $39.00 | 1,191 | 4.7% |
| 5 | SEESE Cordless Pressure Washer Gun, 1000 PSI Portable… | $632K | $2.1M | $32.00 | 1,241 | 6.7% |
| 6 | [medicube] PDRN Collagen Gua Sha Neck Wrinkle Cream | $621K | $1.0M | $30.00 | 2,033 | 7.6% |
| 7 | Comfrt | $585K | $2.7M | $90.74 | 2,263 | 11.9% |
| 8 | [medicube] NAD+ EGF Firming Serum | $447K | $1.7M | $23.00 | 1,823 | 7.9% |
| 9 | (KKPeople Easy-Off Bodysuit) Tummy Control Butt Lifter Faja… | $428K | $1.5M | $25.00 | 714 | 11.3% |
| 10 | Voyage Nova | $404K | $2.0M | $25.00 | 2,353 | 16.0% |
TikTok Shop US, estimated. The feed's 13 to 18 October top 10, each also measured over the 30 days to 18 October with product method sales.
Top affiliates and sellers' own accounts
Creator accounts include brands selling on their own channel. Dolls Kill's account led with an estimated $565K in six days. The second, a tools-and-cleaning account with 15K followers, sold $486K; its pressure washer demo alone sold $174K. Small accounts do well here: four of the ten have under 30K followers.
| # | Account | Followers | Revenue | Units | Avg price |
|---|---|---|---|---|---|
| 1 | @dollskill | 1.9m | $565K | 6.62k | $85.27 |
| 2 | @lz*** | 15k | $486K | 14.99k | $32.46 |
| 3 | @tr*** | 239.3k | $424K | 4.66k | $91.14 |
| 4 | @based | 4.5m | $395K | 10.7k | $36.91 |
| 5 | @ka*** | 26.4k | $372K | 5.41k | $68.75 |
| 6 | @my*** | 338.3k | $364K | 9.01k | $40.42 |
| 7 | @uz*** | 47.7k | $331K | 4.26k | $77.77 |
| 8 | @de*** | 162.2k | $300K | 1.81k | $165.98 |
| 9 | @ai*** | 18.2k | $279K | 8.7k | $32.11 |
| 10 | @er*** | 19.3k | $276K | 2k | $138.28 |
TikTok Shop US, estimated. TokConnect Shop Analytics leaderboard for 13 to 18 October 2026. Source: creator_top_selling. Handles of individual creators are masked; brand accounts are shown.
Videos and LIVEs
The videos and LIVEs that sold most
The top shoppable video, a cordless pressure washer demo from that 15K-follower account, sold an estimated $174K and 5,431 units from 14.6 million views. None of the top 10 selling videos was flagged as AI-generated by the feed. Nine of the ten were posted in October; one went up on 23 August and still sold $99.5K.
| # | Creator | Posted | Revenue | Units | Views |
|---|---|---|---|---|---|
| 1 | @lz*** | 2026-10-12 | $174K | 5,431 | 14.6m |
| 2 | @er*** | 2026-10-15 | $134K | 1,035 | 4.46m |
| 3 | @wr*** | 2026-10-07 | $123K | 3,980 | 14.6m |
| 4 | @ai*** | 2026-10-14 | $113K | 4,203 | 9.87m |
| 5 | @based | 2026-10-11 | $105K | 1,500 | 2m |
| 6 | @nuzzlecomfort | 2026-10-12 | $104K | 2,977 | 2.69m |
| 7 | @sp*** | 2026-10-10 | $101K | 679 | 3.48m |
| 8 | @de*** | 2026-08-23 | $100K | 500 | 1.56m |
| 9 | @we*** | 2026-10-12 | $98K | 1,171 | 3.81m |
| 10 | @ma*** | 2026-10-17 | $95K | 3,303 | 1.7m |
TikTok Shop US, estimated. TokConnect Shop Analytics leaderboard for 13 to 18 October 2026. Source: video_top_selling. Handles of individual creators are masked; brand accounts are shown.
LIVE sales ran long. The top broadcast, BASED's "DEALS FOR YOU", stayed on air for 64 hours 24 minutes and sold an estimated $128K. Dolls Kill held five of the ten places with daily 14-hour costume streams, each selling $78K to $108K.
| # | Host | Started | Length | Revenue | Units | Avg price |
|---|---|---|---|---|---|---|
| 1 | @based | 2026-10-12 | 64h 24m | $128K | 4,081 | $31.41 |
| 2 | @dollskill | 2026-10-15 | 14h | $108K | 1,272 | $84.87 |
| 3 | @dollskill | 2026-10-16 | 14h 1m | $100K | 1,163 | $86.26 |
| 4 | @dollskill | 2026-10-14 | 13h 58m | $95K | 1,108 | $85.58 |
| 5 | @calicurvesfajas | 2026-10-15 | 14h 12m | $94K | 1,534 | $61.02 |
| 6 | @ke*** | 2026-10-13 | 5h 23m | $87K | 687 | $126.13 |
| 7 | @dollskill | 2026-10-12 | 13h 54m | $81K | 927 | $87.89 |
| 8 | @no*** | 2026-10-15 | 12h 8m | $79K | 864 | $91.09 |
| 9 | @dollskill | 2026-10-13 | 13h 56m | $78K | 896 | $87.29 |
| 10 | @ka*** | 2026-10-17 | 18h 5m | $76K | 1,478 | $51.72 |
TikTok Shop US, estimated. The feed's latest top 10 LIVE broadcasts, all started 12 to 17 October 2026. Source: live_top_selling. Handles of individual creators are masked; brand accounts are shown.
Concentration
How concentrated TikTok Shop US is
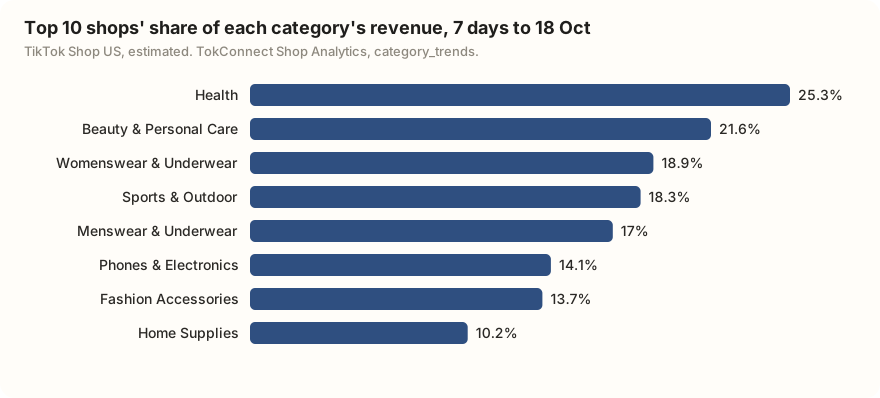
TikTok Shop US is a long-tail market. In the 7 days to 18 October 2026 the top 10 shops held between 10.2% (Home Supplies) and 25.3% (Health) of each large category's revenue. Home Supplies has the most sellers, 18,406 shops, and the least concentration.
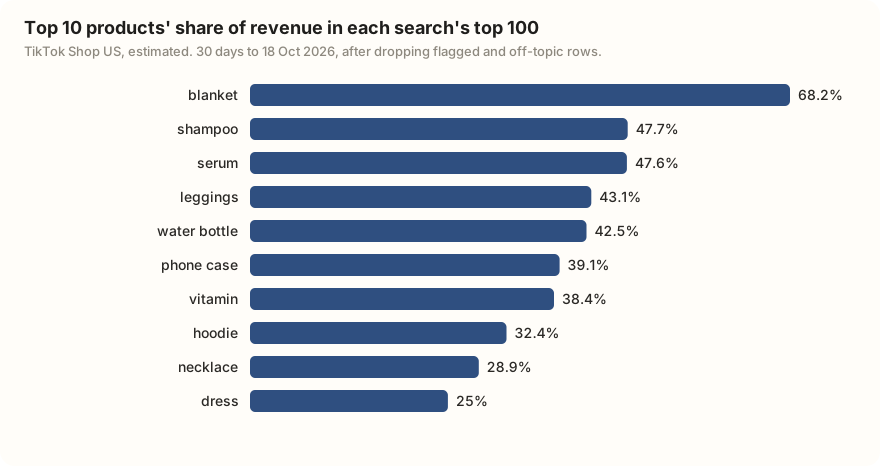
Within a single product search the picture changes. We ranked the top 100 products for 10 everyday searches over 30 days. In "blanket", the top 10 took 68.2% of the revenue and one product, Comfrt's Dreamer Blanket, took 36.2% on its own. In "dress", the top 10 took only 25.0%.
| Search | Products kept | 30-day revenue | Top 10 share | Top 1 share | Leader |
|---|---|---|---|---|---|
| blanket | 76 | $7.3M | 68.2% | 36.2% | Comfrt |
| shampoo | 83 | $7.3M | 47.7% | 11.7% | Bare Anatomy Ultra Smoothing Hair Trio |
| serum | 79 | $15.5M | 47.6% | 11.3% | [medicube] NAD+ EGF Firming Serum |
| leggings | 88 | $13.5M | 43.1% | 7.9% | Halara UltraSculpt High Waisted Tummy Control… |
| water bottle | 92 | $1.7M | 42.5% | 8.0% | The Flowstate™ Spring Water Bottle |
| phone case | 77 | $1.6M | 39.1% | 12.4% | Magnetic Stand Liquid Silicone Full Coverage… |
| vitamin | 89 | $12.3M | 38.4% | 9.5% | Magnesium Complex for Women, 240 Vegetarian… |
| hoodie | 93 | $12.2M | 32.4% | 5.1% | Comfrt |
| necklace | 84 | $2.2M | 28.9% | 4.2% | PAVOI 14K Gold Plated Station Necklace for Women |
| dress | 79 | $8.0M | 25.0% | 3.9% | CurvySweet Athena Women's Elegant Knitted… |
TikTok Shop US, estimated. 30 days to 18 October 2026 (19 September to 18 October). Source: product_top_selling, keyword, 100 rows sorted by revenue.
Price
What price sells on TikTok Shop US
TikTok Shop US sells in the middle. Across 829 top-selling products in our 10 searches, products averaging $20 to $35 made 39.7% of estimated revenue in the 30 days to 18 October 2026. Products under $35 made 59.6%, and the median price was $27. Cheap items rarely win on revenue: products under $10 were 5.8% of the list but made 2.0% of the money.
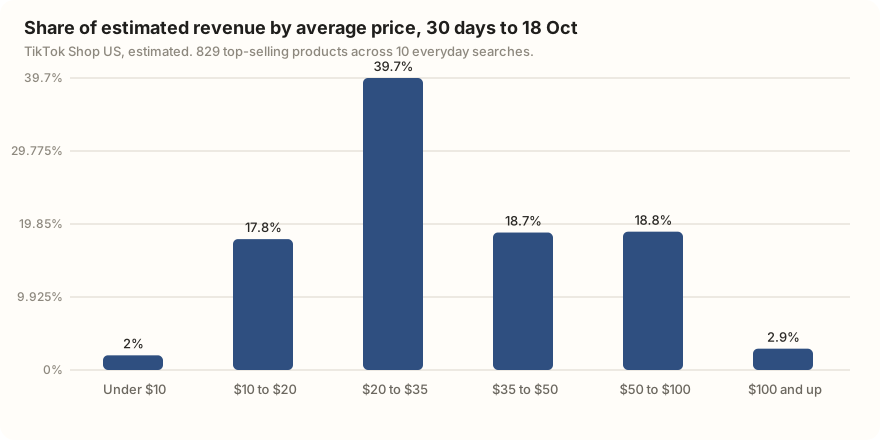
| Price band | Products | Share of products | 30-day revenue | Share of revenue |
|---|---|---|---|---|
| Under $10 | 48 | 5.8% | $1.6M | 2.0% |
| $10 to $20 | 210 | 25.3% | $14.2M | 17.8% |
| $20 to $35 | 304 | 36.7% | $31.7M | 39.7% |
| $35 to $50 | 133 | 16.0% | $14.9M | 18.7% |
| $50 to $100 | 109 | 13.1% | $15.0M | 18.8% |
| $100 and up | 25 | 3.0% | $2.3M | 2.9% |
TikTok Shop US, estimated. 30 days to 18 October 2026 (19 September to 18 October). Average selling price per product. Data.
Who sells
Affiliate vs own-account sales on TikTok Shop US
Affiliates run TikTok Shop US. In the eight largest categories, affiliate creators drove 77.2% of estimated revenue in the 7 days to 18 October 2026. Sellers' own accounts drove 10.4% and the Shop mall (the shop tab and search) 12.4%. Among the top 10 shops over 30 days the affiliate share rises to 82.3%.
Eight largest categories, 7 days to 18 Oct
Top 10 shops, 30 days to 18 Oct
Affiliates Own accounts Shop mall
Fashion Accessories leans least on affiliates, at 60.2%, with 23.8% through the mall. Beauty & Personal Care leans most, at 82.4%. By format, short videos made 68.1% of category revenue, LIVE 14.5% and the shop tab and search 17.4%. For what these terms mean in a seller's account, see what GMV means on TikTok.
Your turn
Run this report for your own niche
Every table in this report comes from a question you can ask TokConnect yourself, in TokConnect Chat or in your own AI. One example per tool we used:
Tool: product_top_selling
Rank the top 20 TikTok Shop US products for "[your product]" by estimated revenue in the last 30 days, with price, units, creators and LIVE share.
Tool: shop_top_selling
Find the TikTok Shop US shop for [brand name] and show its estimated revenue for the last 30 days, split by affiliates, own accounts and the Shop mall.
Tool: category_trends
Show TikTok Shop US categories by estimated revenue for the last 7 days, with growth, top-10 shop share and LIVE share.
Tool: creator_top_selling
List the top 20 TikTok Shop US affiliates with [your niche] in their name or bio who list an email, ranked by estimated revenue in the last 30 days.
Tool: video_top_selling and live_top_selling
Show the top-selling TikTok Shop US videos and LIVEs this week, with revenue, units and views.
Or open the free TikTok Shop analytics tool, and see the live rankings on TikTok Shop trends.
Methodology
How we got these numbers
Sample
TikTok Shop US data. Six leaderboards (products, shops, brands, creators, videos and LIVEs) from TokConnect Shop Analytics with no keyword, which the feed fixes to its overall top 10 for 13 to 18 October 2026. The category table (category_trends, levels 1 and 2), which always covers the latest 7 days: 12 to 18 October. Thirty-day measurements of each leaderboard shop and product (shop and product method sales, 19 September to 18 October). And the top 100 products by 30-day revenue for 10 everyday searches.
How we chose what to pull
We fixed the call list before pulling any ranking data: the six leaderboards, the category table, a 30-day sales call for every leaderboard entity, and one or two everyday product words for each large category ("serum", "shampoo", "dress", "leggings", "water bottle", "necklace", "vitamin", "phone case", "hoodie", "blanket"). We also fixed the price bands and the rule to drop flagged rows. Only response shapes were checked first.
Two changes after the first pull
A 100-row response came back shortened to 78 rows, so we re-pulled each search as two pages of 50. And keyword matching proved loose (a rice-water hair spray ranked under "water bottle"), so we added one mechanical rule: keep a row only if its title contains every word of the search, plurals allowed. That dropped 25 rows. We dropped 135 more that the feed flags for an unreliable price (a placeholder price makes their revenue unreliable). 829 products remain.
What the numbers are
Estimates. Units track TikTok's own sold counter and revenue is units times the listed price, from TikTok Shop sold counts and listed prices. Growth is only shown for 7-day windows, against the 7 days before. Affiliate, own-account and mall shares split revenue by who made the sale; video, LIVE and showcase shares split it by format.
Limits
The category table lists the eight largest top-level categories, not all of them, so $333.6 million is not TikTok Shop US's whole weekly total. The shop and product lists start from a 6-day leaderboard, so a shop that sold strongly earlier in the 30 days but not that week can be missing. Search samples reflect how sellers title products. LIVE rankings are by broadcast.
Download the data
The dataset (JSON, CC BY 4.0) has every table here plus all 829 product rows. The raw pulls hold every call in order, with its arguments and full response. Pulled 20 October 2026 with TokConnect MCP v3.1.0.
Before you cite or buy
Accuracy, rules and price
Is it accurate?
The figures are estimates from TikTok Shop sold counts and listed prices, built from TikTok's own sold counters and listed prices. Check any row: the shop and product ids are in the dataset.
Is it allowed?
TokConnect is read-only and uses public data. It never logs in to your TikTok or Seller Center and never posts or messages anyone.
What does it cost?
50 free credits with no card. Every plan includes Shop Analytics: Starter is $49 a month for 500 credits. One call is one credit, and failed calls are free.
Does it work in my AI?
Yes. One click connects ChatGPT and Claude, Cursor takes one line, or use TokConnect Chat with nothing to set up.
FAQ
TikTok Shop revenue and sales: questions
How much does TikTok Shop US sell in a week?
The eight largest TikTok Shop US categories sold an estimated $333.6 million in the 7 days to 18 October 2026, up 10.4% on the week before. Beauty & Personal Care alone made $95.0 million of that. These are TokConnect Shop Analytics estimates and leave out the smaller categories.
What is the biggest shop on TikTok Shop US right now?
medicube US Store. It topped the 13 to 18 October 2026 leaderboard and sold an estimated $29.1 million in the 30 days to 18 October, about twice Comfrt's $15.0 million in second place. 84.8% of medicube's revenue came through affiliate creators.
What was the top-selling TikTok Shop US category in October 2026?
Beauty & Personal Care, with an estimated $95.0 million in the 7 days to 18 October 2026, or 28.5% of the eight largest categories. Womenswear & Underwear came second at $81.2 million. Menswear & Underwear grew fastest, up 24.9% on the week before.
How much of TikTok Shop revenue comes from affiliates?
About three quarters. Affiliate creators drove 77.2% of estimated revenue across the eight largest TikTok Shop US categories in the 7 days to 18 October 2026, and 82.3% of the top 10 shops' revenue over 30 days. Sellers' own accounts drove 10.4% and the Shop mall 12.4%.
What price sells best on TikTok Shop?
$20 to $35. Products averaging $20 to $35 made 39.7% of estimated revenue across 829 top-selling TikTok Shop US products in 10 everyday searches over the 30 days to 18 October 2026. 59.6% of that revenue came from products under $35, and the median price was $27.
Can I download the TikTok Shop report data?
Yes. The full dataset is a free JSON file under CC BY 4.0: every table on the page plus all 829 product rows behind the price and concentration figures. A second file holds every raw call we ran. Credit TokConnect with a link to this page.
More on TikTok Shop: TikTok Shop trends · TikTok Shop statistics · Black Friday 2026 tracker · Holiday gift trends 2026 · Check a competitor's sales · For TikTok Shop sellers
Get your own numbers before the next report
Ask TokConnect what sold most in your category over the last 30 days, and get the same tables for your niche in a minute. 50 free credits, no card.