
Share of voice on TikTok: measure it with searches, views and comments
Share of voice on TikTok is your brand's slice of a category's searches, views and engagement. TokConnect pulls TikTok's own brand search counts, rivals' recent post reach and comments, so you can measure it monthly.
Step zero
What share of voice means
Share of voice is your brand's portion of all the attention in a category, written as a percentage. You take your count, divide it by the total for you and the rivals you chose, and multiply by 100.
The count is the whole question. Media teams count ad impressions. PR teams count mentions. On TikTok you can count three things people actually do: search for your name, watch your posts, and engage with them. Comments then tell you why.
TikTok sells its own version. Market Scope's Brand perception module is described as "advanced social listening tailored to TikTok", and it is available to select customers. What Market Scope covers, and how to get access.
The formula
Worked once
Owala's brand searches in 7 days, over the total for five drinkware brands. Pulled 10 October 2026.
The method
How to measure TikTok share of voice in six steps
Pick the set
Four to six brands a buyer actually weighs against yours. We took reusable drinkware: Stanley, Owala, Hydro Flask, YETI and Simple Modern.
Pull brand searches
Search each brand name and keep every topic that names the brand in your sense. Drop other meanings: "stanley cup" brings hockey finals, "yeti" brings the creature and games. Leave out TikTok labels (5M or more, or 1M or more with a near-zero first day).
Divide by the set
Sum each brand's 7-day searches and divide by the total. That is share of searches.
Check one curve per brand
A 7-day count can spike. Pull 180 days for one anchor topic per brand so you know whether this week is normal.
Pull recent posts
Views, likes and saves on each brand account's latest posts. Share of views is reach; share of likes is how much of that reach people cared about.
Read the comments
Label the top 50 comments on each brand's biggest recent post by theme, and count them.
List every TikTok search that names [your brand] and [competitor], with 7-day searches and video counts. Leave out topics where the name means something else.
Pull brand searchesThe example
Five drinkware brands, three ways to count voice
Same five brands, same day, three answers. Owala leads searches and likes. Stanley owns views. The bars below are pulled from TokConnect on 10 October 2026.
Share of voice by measure, 10 October 2026
Searches 7-day brand searches
Views latest 19 to 20 posts
Likes same posts
| Brand | Searches, 7 days | Share | No videos | Post views | Share | Median | Likes per 1K |
|---|---|---|---|---|---|---|---|
| Owala | 4,091,459 | 36.9% | 14 of 20 | 1,439,800 | 12.1% | 23,950 | 57.23 |
| Hydro Flask | 2,849,578 | 25.7% | 8 of 19 | 208,948 | 1.8% | 6,474 | 12.8 |
| YETI | 2,166,460 | 19.6% | 4 of 6 | 642,096 | 5.4% | 3,594 | 33.55 |
| Stanley | 1,436,751 | 13.0% | 2 of 9 | 9,377,510 | 78.6% | 12,100 | 1.94 |
| Simple Modern | 533,553 | 4.8% | 0 of 3 | 267,097 | 2.2% | 6,316 | 5.2 |
Brand searches are the topics naming the brand's drinkware in the first 20 TikTok returned for each name; the kept and dropped topics, with reasons, are in the data. Owala and Hydro Flask filled 20 and 19 of 20 with brand topics, so their totals are floors. Post windows differ: Stanley's 19 posts run from 24 August, Simple Modern's 20 from 26 September.
Views without likes
Three posts carried 97.0% of Stanley's 9,377,510 views. They drew 0.43 likes per 1,000 views; its other 16 posts drew 51.5. Report reach and engagement side by side, or one fall teaser decides your month.
Searched and liked
Owala led searches at 36.9% and likes at 65.3%, with 4.91 saves per 1,000 views against Stanley's 0.13. 14 of its 20 brand searches had no videos, such as "how to fix your owala cap".
A few big product searches
Six YETI topics added up to 19.6% of searches, led by "yeti sidekick 6l seafoam" at 858,357 with no videos. Its own posts held 5.4% of views.
Pull the last 20 TikTok posts from @[your brand] and @[competitor]. Show total views, median views, likes and saves per 1,000 views, and how much of the views the top 3 posts carry.
Compare post reachThe posts behind the views
Each brand's top recent video
The most-viewed of each account's latest posts. Stanley's teaser had 4.5 million views and 857 likes; Owala's Pokémon launch had 530,200 views and 40,600 likes.
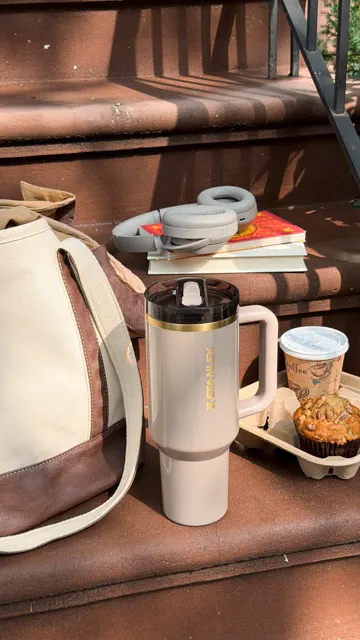
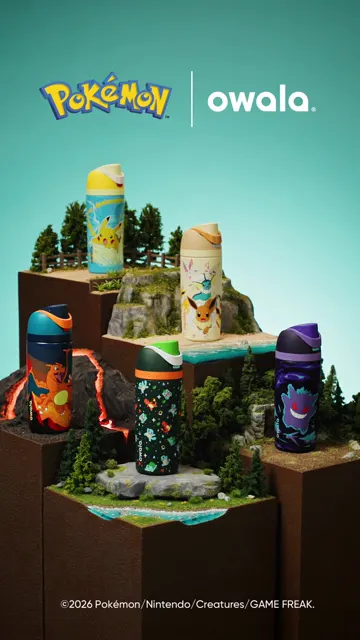

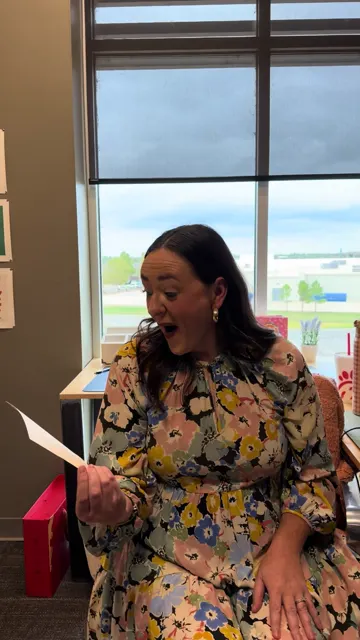
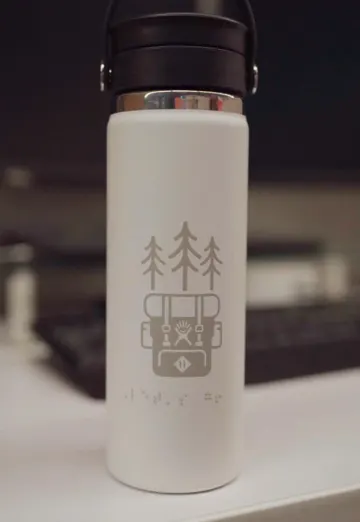
Covers saved from public brand accounts on 10 October 2026; each links to the original post.
Is this week normal?
The 180-day curve behind the weekly number
A weekly count tells you where a brand stands. The curve tells you whether that week was typical. We pulled 180 days for one product topic each from the two search leaders.
"Owala colors" had a reading on all 181 days. It climbed from 118,158 on 23 May to 763,483 on 11 August, then settled at 139,712 on 10 October. Its single highest day was 4,067,732 on 29 July. "30 oz stanley cups" shows no readings before 2 August; it peaked at 774,802 on 16 September.
So Owala's October share was measured while one of its main product searches sat well below its summer high. Next month's report should say so.
Daily readings, every 10th day
Owala colors
30 oz stanley cups
Why the numbers move
What the comments add
Read the top 50 comments on [competitor]'s most-viewed TikTok this month and count them by theme, with one short quote per theme.
Count comment themesBrand tracking
A monthly brand-tracking template for TikTok
Run it on the same day each month with the same topic list, adding new brand topics as they appear. The last two columns are the October 2026 baseline from this run.
| Metric | Tool | How | Owala, Oct | Stanley, Oct |
|---|---|---|---|---|
| Brand searches, 7 days | search_topics | Sum the topics naming the brand | 4,091,459 | 1,436,751 |
| Share of searches | From above | Brand ÷ set total | 36.9% | 13.0% |
| Brand searches with no videos | search_topics | Count topics with 0 videos: your content gaps | 14 of 20 | 2 of 9 |
| Anchor topic, reading on the 10th | search_popularity | One dated point from the 180-day curve | 139,712 | 258,869 |
| Views on latest posts | creator_posts | Sum, and note the date window | 1,439,800 | 9,377,510 |
| Share of views | From above | Brand ÷ set total | 12.1% | 78.6% |
| Top 3 posts' share of views | creator_posts | Flags months carried by one or two posts | 63.6% | 97.0% |
| Share of likes | creator_posts | Brand likes ÷ set total | 65.3% | 14.4% |
| Saves per 1,000 views | creator_posts | Saves ÷ views × 1,000 | 4.91 | 0.13 |
| Top comment themes | video_comments | Label the top 50 on the biggest post | Supply 17, abroad 14 | Next run |
Anchor topics: "Owala colors" and "30 oz stanley cups". TokConnect returns the raw counts; your AI does the sums in the same chat.
Run a monthly TikTok brand-tracking report for [your brand] against [competitors]: share of searches, share of views and likes on latest posts, one 180-day curve point per brand, and top comment themes. Compare with [last month's numbers].
Run the monthly reportWhere it fits
What this method covers, next to your other tools
| Signal | In TokConnect |
|---|---|
| TikTok's own search counts for any list of brand names, 7-day and 180-day | Yes |
| Any brand account's public posts: views, likes, saves, comments | Yes |
| Comment text for theme counts | Yes |
| Searcher age, gender and country per topic | Yes |
| Rivals' ad spend or CPMs | No |
| Follower history | No, current counts only |
| Creator audience demographics, private analytics | No |
Whatever competitive intelligence tools you already pay for, TikTok search counts add the one signal a buyer creates on purpose: typing your name. TokConnect runs in its own chat or inside ChatGPT, Claude and Cursor, so the monthly report is one prompt.
This run used 25 calls. You start with 50 free credits, and plans run from $49 for 500 credits to $199 for 8,000 a month. See pricing.
Agencies running this for several clients: TikTok tools for agencies. Brand teams: TikTok for brands. For a full rival audit beyond voice: TikTok competitor analysis.
Questions about share of voice
What is share of voice in marketing?
Share of voice is your brand's portion of all the attention in a category, written as a percentage: your count divided by the total for you and the competitors you chose, times 100. The count can be ad impressions, mentions, searches, views or engagement, so always say which one you used.
How do you calculate share of voice on TikTok?
Pick four to six brands buyers compare, sum each brand's TikTok search counts and the views and likes on its latest posts, then divide each brand by the set total. TokConnect pulls the search counts, posts and comments in one chat. On 10 October 2026, Owala held 36.9% of searches across five drinkware brands.
What is a good share of voice?
There is no fixed benchmark. What matters is your share against the rival you lose sales to, and which way it moves month to month. Compare measures too: in our drinkware sample Stanley had 13.0% of searches but 78.6% of recent views, so one number alone would have told the wrong story.
How often should you track brand share of voice?
Monthly suits most brands, on the same day each month with the same topic list. TikTok search counts cover the last 7 days, so one week can spike. Keep a 180-day curve for one anchor topic per brand to see whether a month is normal.
How we got these numbers
On 10 October 2026 we pulled public TikTok data through TokConnect, 25 calls in all:
search_topicsfor "stanley cup", "owala", "hydro flask", "yeti" and "simple modern" (20 topics each);user_profilefor @stanley1913, @owala, @hydroflask, @yeti and @simplemodern (two first guesses at handles failed or hit a personal account and were not used);creator_postsfor the latest 20 posts of each brand (Stanley returned 19);search_popularity(180 days) for "30 oz stanley cups" and "Owala colors";video_comments(top 50) on Owala's Pokémon post, labelled by theme by us;video_detailfor the five covers shown, saved to tokconnect.com.
Search counts are TikTok's global 7-day search popularity from Creator Search Insights. A topic of 5M or more, or of 1M or more whose first daily reading is under 5% of its last, is treated as a TikTok label and not counted. Brand topics are those naming the brand's drinkware; ambiguous ones, such as "gold stanley cup", are left out. Market Scope facts are from TikTok's help center, checked 10 October 2026. Commenter names are removed. Open the data.
We read the top 50 of the 721 comments on Owala's Pokémon launch and gave each one theme. The loudest theme was supply, not the design.
17 comments asked for a restock, a website drop or blamed resellers, and 6 named scalpers outright. The most-liked comment, at 1,438 likes, asked Owala to "drop on your website". Another 14 asked when the bottles would sell abroad, in Spanish, Italian and English.
For share of voice, that is the context a percentage hides. Owala's voice that week was partly frustration about not being able to buy, which is a different problem from not being noticed.
Owala Pokémon post, top 50 comments by theme