tokconnectStart free
- You can't predict which video or sound goes viral, but search demand for a topic often rises weeks before it peaks.
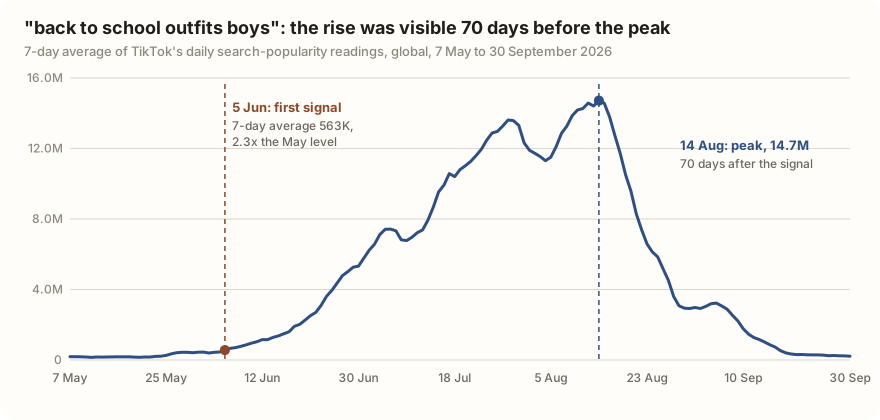
- "back to school outfits boys" passed twice its May level on 5 June and peaked on 14 August, 70 days later. It fell below half the peak nine days after.
- Flag a topic when its 7-day average is at least twice the four weeks before, and act only if it is still there a week later.
- One-day and one-week jumps mislead: 8 of 11 topics our daily riser list flagged were lower two to four days later.
- Ignore TikTok's April 2026 history readings and treat long runs of zeros as missing data, not zero demand.
You can't predict which TikTok video, sound or meme will go viral, but you can often see a trend coming in search data before it peaks. People start typing a topic into TikTok search days or weeks before it tops out. In our 180-day pulls, "back to school outfits boys" passed twice its May level on 5 June and peaked on 14 August: 70 days of warning. Fall Room Decor gave at least 10 days. A plain weekly check catches these rises; it also throws false alarms, and we counted them.
This is how to predict TikTok trends in practice: watch search demand for the topics your brand could make videos about, flag the ones that double against their own recent level, and confirm a week later before you commit. It works best for seasonal and product topics. It will not tell you which dance takes off tomorrow.
Checked 30 September 2026. All numbers are from TikTok Creator Search Insights via TokConnect, pulled that day, and from our daily trend snapshots of 26 to 30 September.
How early does TikTok search show a trend?
Early enough to plan around, for topics that build. We took six topics that rose this year, four seasonal and two from our weekly riser list, and measured the gap between the first clear signal and the peak. The signal is the first day the 7-day average of TikTok's daily search-popularity readings reached twice the topic's own starting level.
| Topic | History starts | Starting level (daily average) | First signal (2x) | Highest 7-day average | Signal to peak | What happened |
|---|---|---|---|---|---|---|
| back to school outfits boys | 1 May | 240,321 | 5 Jun | 14,721,939 (14 Aug) | 70 days | Real seasonal trend, peak passed |
| Fall Room Decor | 3 Aug | 130,816 | 15 Aug | 855,182 (25 Aug) | 10+ days | Real, under half its peak by 16 Sep |
| Couples halloween costumes | 3 Aug | 55,656 | 6 Sep | 278,972 (28 Sep) | 22+ days so far | Still rising a month before Halloween |
| Group Halloween Costumes | 3 Aug | 81,260 | 12 Aug | 234,693 (26 Sep) | 45 days so far | Signal came from a one-day spike; the steady climb began in September |
| Amazon Travel Must Haves | 4 Aug | 38,609 | 28 Aug | 106,503 (15 Sep) | 18 days | Modest rise, now easing |
| booktok ideas | 1 May | 330,321 | None | 462,848 (4 Jun) | None | False alarm: flagged as a riser twice in five days, but below its May level |
Data: TikTok Creator Search Insights via TokConnect, 180-day global search popularity pulled 30 September 2026, April readings excluded. "History starts" is the first day with a non-zero reading from 1 May. Histories and calculations, topic lookups.
The lead time is longest when the trend is tied to a date everyone knows. School starts, autumn arrives, Halloween falls on 31 October. Those topics climb for weeks, and the climb shows in search long before the peak. Topics with a "+" had no history before early August, so their real lead was at least that long.
What does a TikTok trend look like in search data?
It has four stages you can date. Back-to-school is the cleanest example we have, because TikTok kept its full history from May.
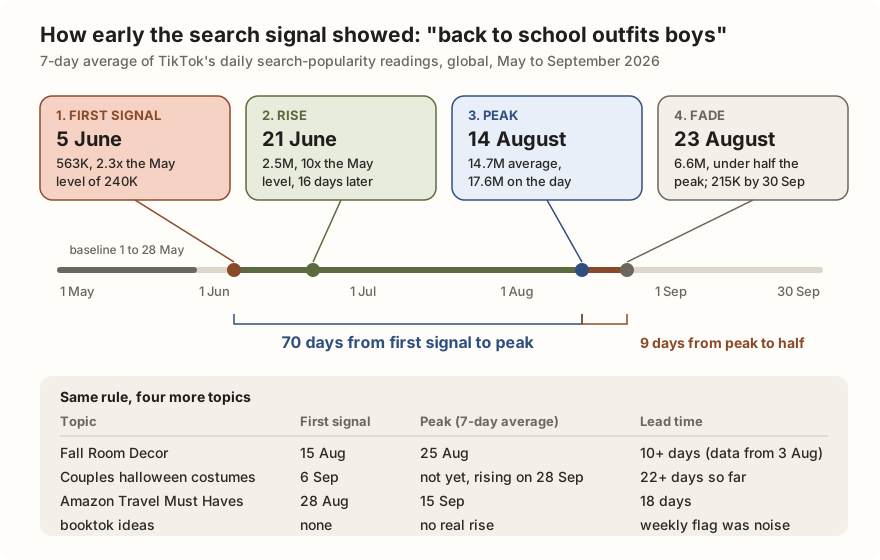
First signal. On 5 June the 7-day average hit 563K, 2.3 times the May level. Nothing about it looked viral. It was a slow, steady lift you would only notice by comparing against May.
Rise. Sixteen days later it was ten times the May level. By then the trend is obvious to anyone watching, and it still had 54 days to run. This is the comfortable window for a brand: time to brief creators, film and post before the crowd.
Peak. 14 August, with a 7-day average of 14.7M and a single-day high of 17.6M.
Fade. Nine days after the peak the average was under half, and by 30 September it was back below where it started. Going down is much faster than going up, so a video that lands after the peak catches very little search traffic.
How to predict TikTok trends: a weekly routine for brands
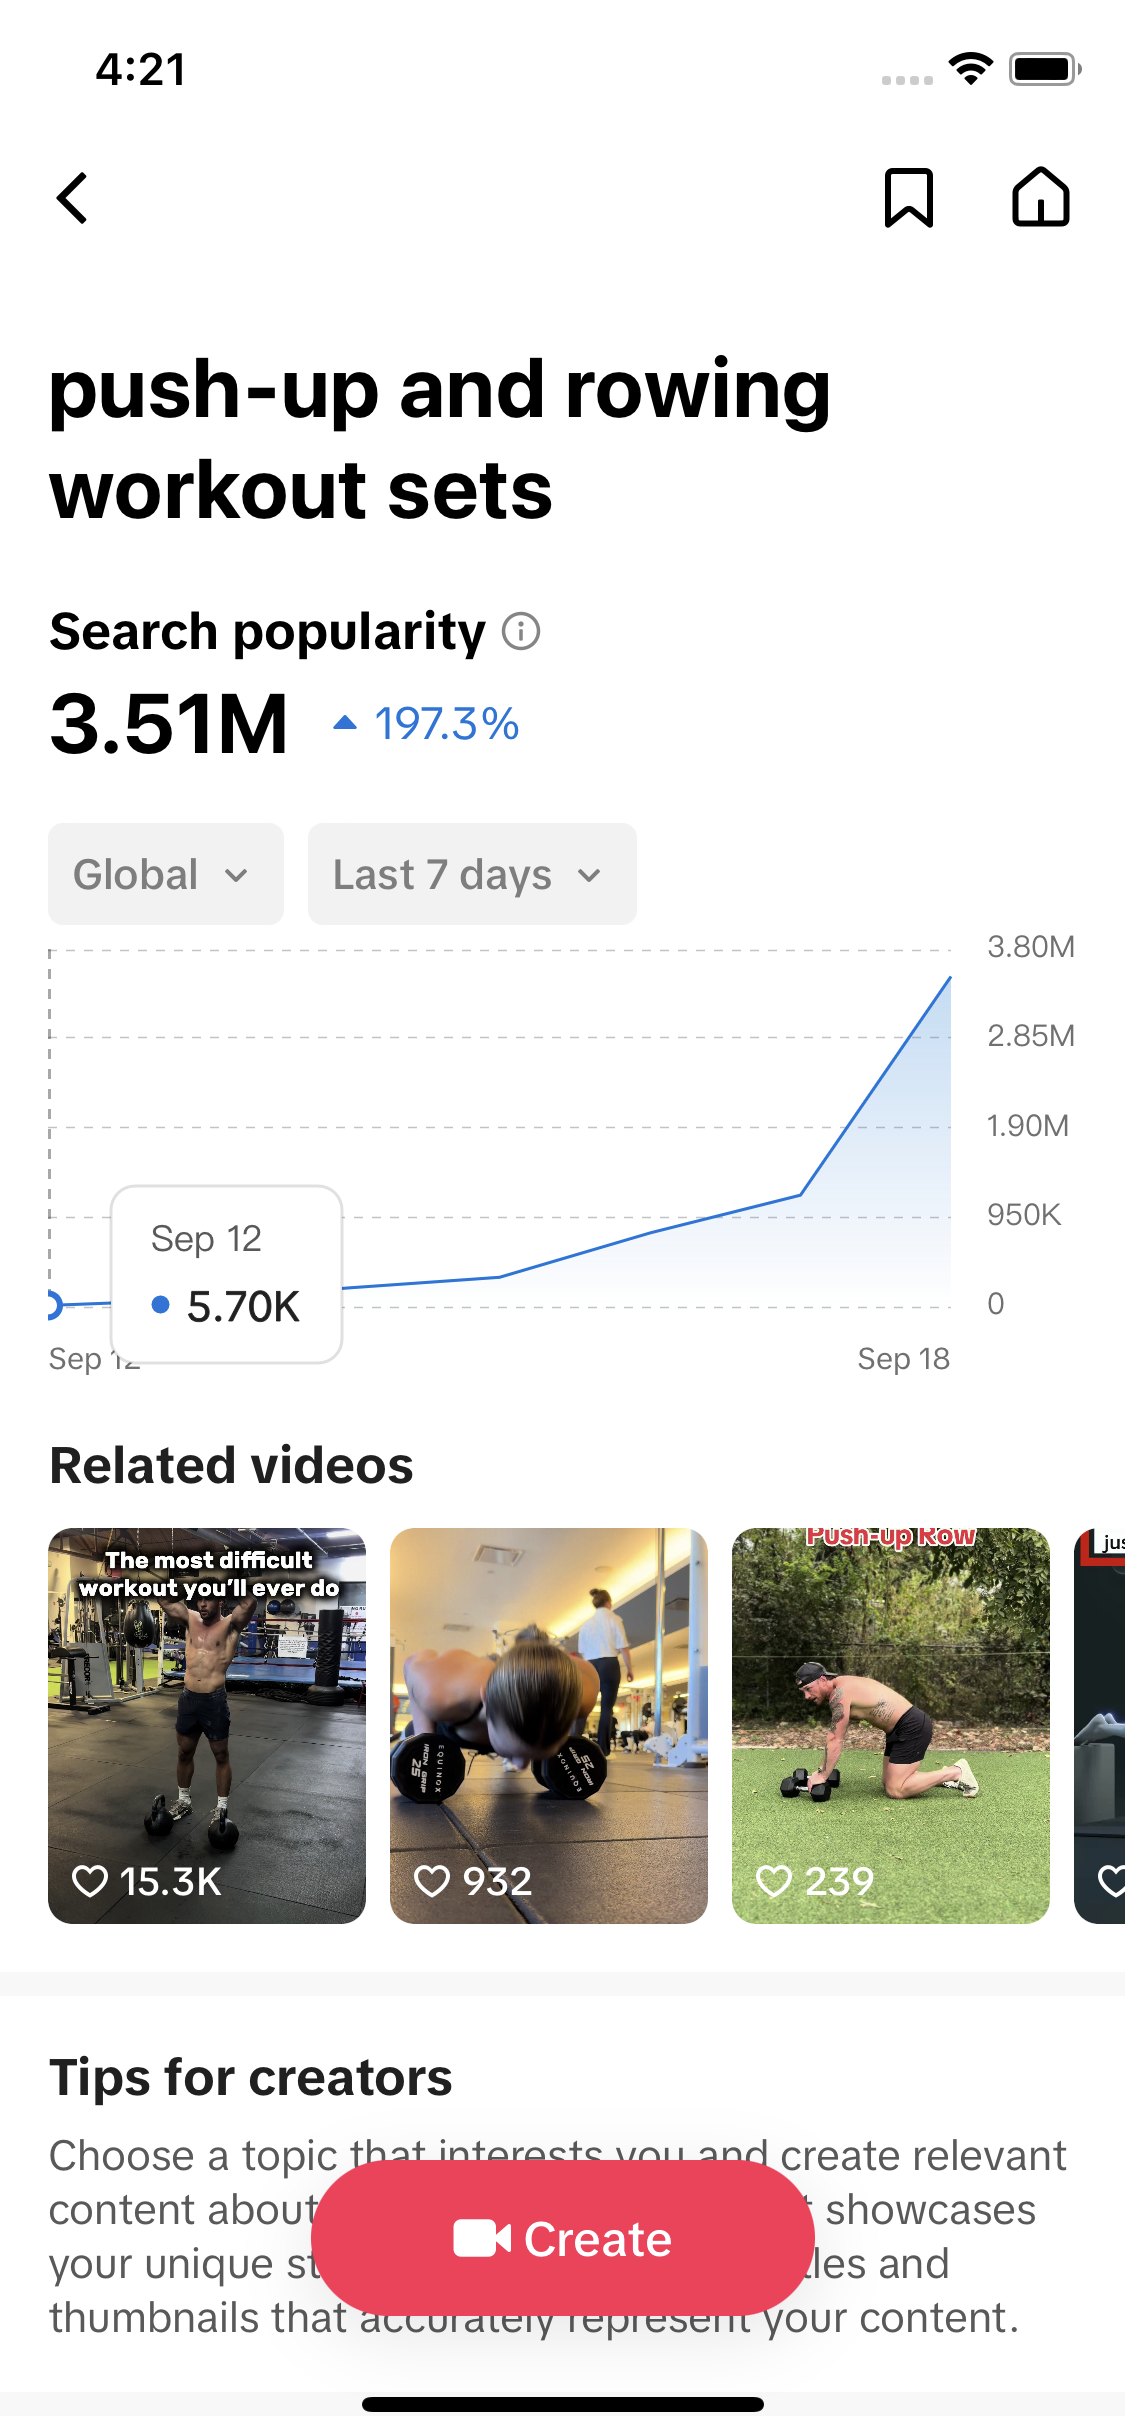
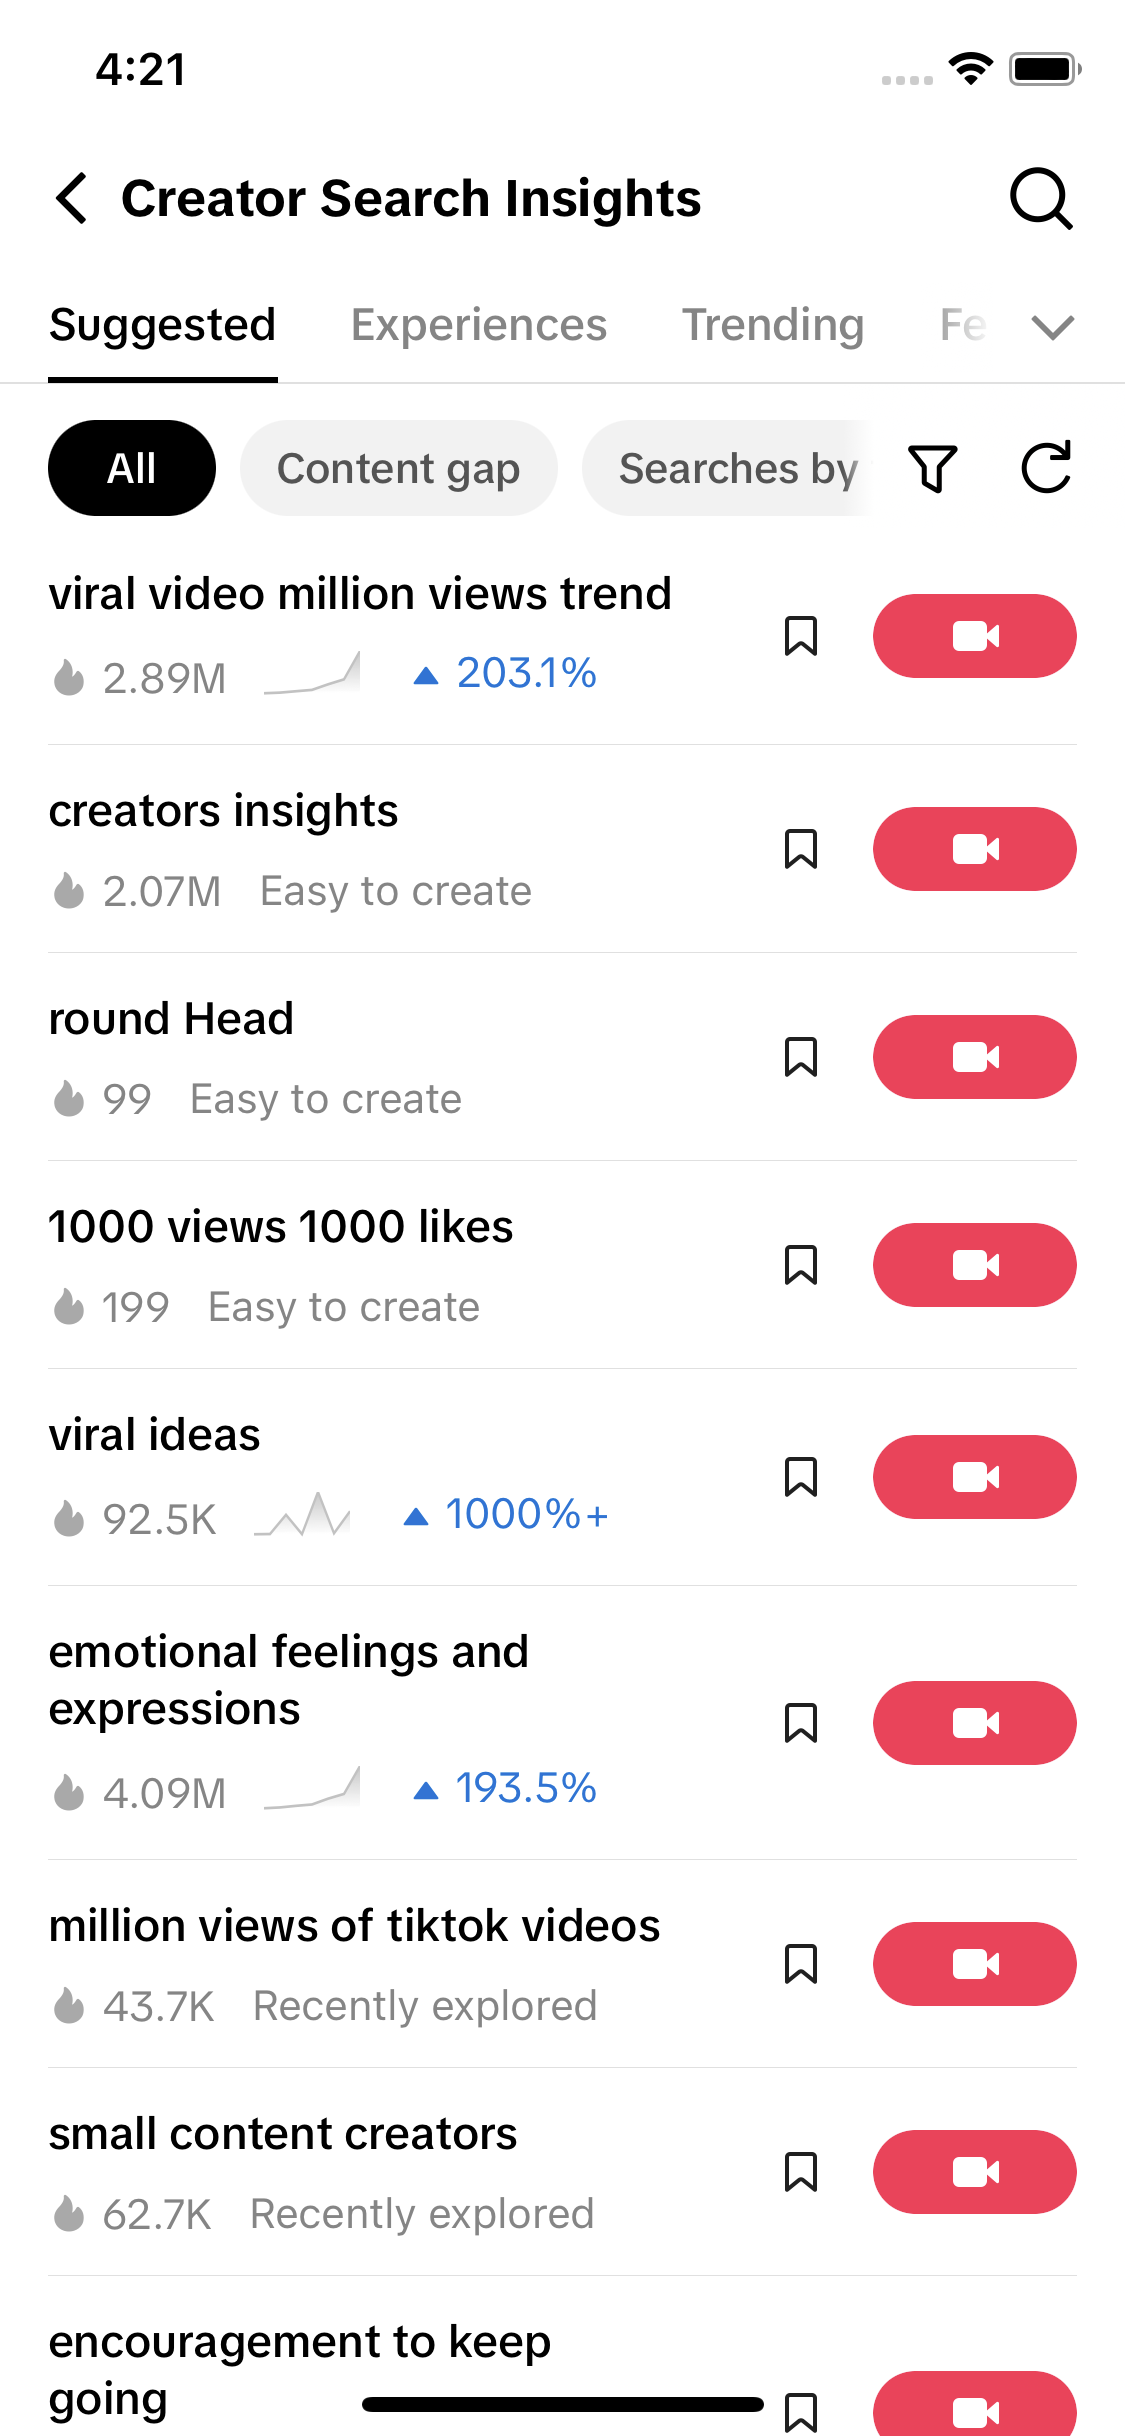
The routine takes about twenty minutes a week once your list is set. You need TikTok's search data, which lives in Creator Search Insights in the TikTok app and on desktop at tiktok.com/csi. Neither offers an export or a long history view, so you either note the numbers by hand or pull them with a tool.
1. Pick 10 to 20 searches you could act on
Use the words your buyers type: product types, occasions, problems. Skip TikTok's generated labels. Our "halloween costume" lookup returned ten of them, all between 2.8M and 4.7M with the same hockey-stick curve, so every one of them "rises" and none of them tells you anything. Pick the typed searches with a jagged history instead. The search volume guide explains what the numbers mean.
2. Get each topic's history and drop the bad parts
Pull 180 days where you can. Ignore April 2026: TikTok's 180-day history has implausible April readings, such as a lone zero among six-figure days for back-to-school, and a single 1.13M day for booktok ideas that beats every day from May to September. Also treat a long run of zeros that suddenly ends as missing history, not zero demand.
3. Compare this week with the four weeks before
Average the last seven daily readings. Average the 28 days before that. If this week is at least twice the earlier level, flag the topic. A week-over-week jump is not enough on its own, as the next section shows.
4. Confirm a week later, then check the videos
If the topic is still at 2x or higher next week, treat it as real. Look at how many videos TikTok lists for it. A rising search with a few hundred videos, like Couples halloween costumes at 634, is an opening; one with tens of thousands is already crowded. The content gaps page lists searches with few videos.
5. Work back from the likely peak
For dated topics, the peak is the date. For the rest, our back-to-school topic went from 10x to peak in 54 days, so a confirmed signal usually leaves you weeks, not days. Post before the peak, then stop: the fade took nine days.
Show the 180-day TikTok search history for [your product] and tell me the first week it passed twice its usual level.
How often is an early signal wrong?
Often, if you trust one day or one week. We checked three rules against what happened next.
| Rule | Times it fired | Lower when we checked again |
|---|---|---|
| Our daily riser list, topics flagged 26 to 28 Sep, rechecked 30 Sep | 34 topics, 11 still in the 30 Sep pull | 8 of 11 (the other 23 had dropped out of the results) |
| 7-day average up 50% on the week before (six topics, May to Sep) | 65 days | 17 of 65 two weeks later; 17 of 29 outside the back-to-school run |
| 7-day average at 2x the four weeks before | 45 days | 1 of 45 two weeks later, but 39 of the 45 were back-to-school |
Data: TokConnect daily snapshots, 26 to 30 September 2026 (riser check), and the 180-day histories above (calculations).
The riser lists catch topics on a good day. booktok ideas shows it well: our daily page flagged it on 26 September with a week-on-week jump of 137%, and again on 30 September at 71%. Its 180-day history tells a different story. The 7-day average on 30 September was 208K, below its May level of 330K. Nothing was trending; the week before was just a weak week.
Amazon Travel Must Haves was flagged on 30 September after one strong day. Its real rise happened in late August, and its 7-day average peaked on 15 September.
Acting on a one-day or one-week jump. Always compare against at least four weeks of history and wait for a second week above 2x. It costs you a week of lead time and saves you most of the false alarms.
What can't search data predict?
Virality. A video, sound or dance can blow up on the For You feed before anyone searches for it, and search only follows. For those, watch sounds and formats; the trending sounds guide covers how.
Short histories limit the method too. Five of the seven 180-day histories we pulled were zero until 31 July to 3 August and then started at full strength, so for most topics you get about two months, not six. And TikTok shows search popularity globally unless you pick a country, so a US holiday can look smaller than it is in the US.
Finally, news spikes give no warning at all. A topic that goes from nothing to millions in a day was not predictable from search; the only move is to react fast.
Which other early signals are worth watching?
Search is one input. Others show things search can't:
- TikTok Creative Center. Its trends hub shows popular hashtags, songs, creators and videos. Good for formats, weaker for buying intent.
- Your own For You feed and comments. Repeated sounds, phrases and "where is this from?" comments show demand forming before it has a search term.
- Google Trends. Useful for a second opinion on seasonal timing. The Google Trends for TikTok guide compares the two.
- A trend tracker. Our free tracker refreshes rising searches daily; the trend research guide lists all seven places to look, earliest first.
Which Halloween costume searches on TikTok have doubled in the last four weeks, and how many videos does each one have?
Do this in TokConnect
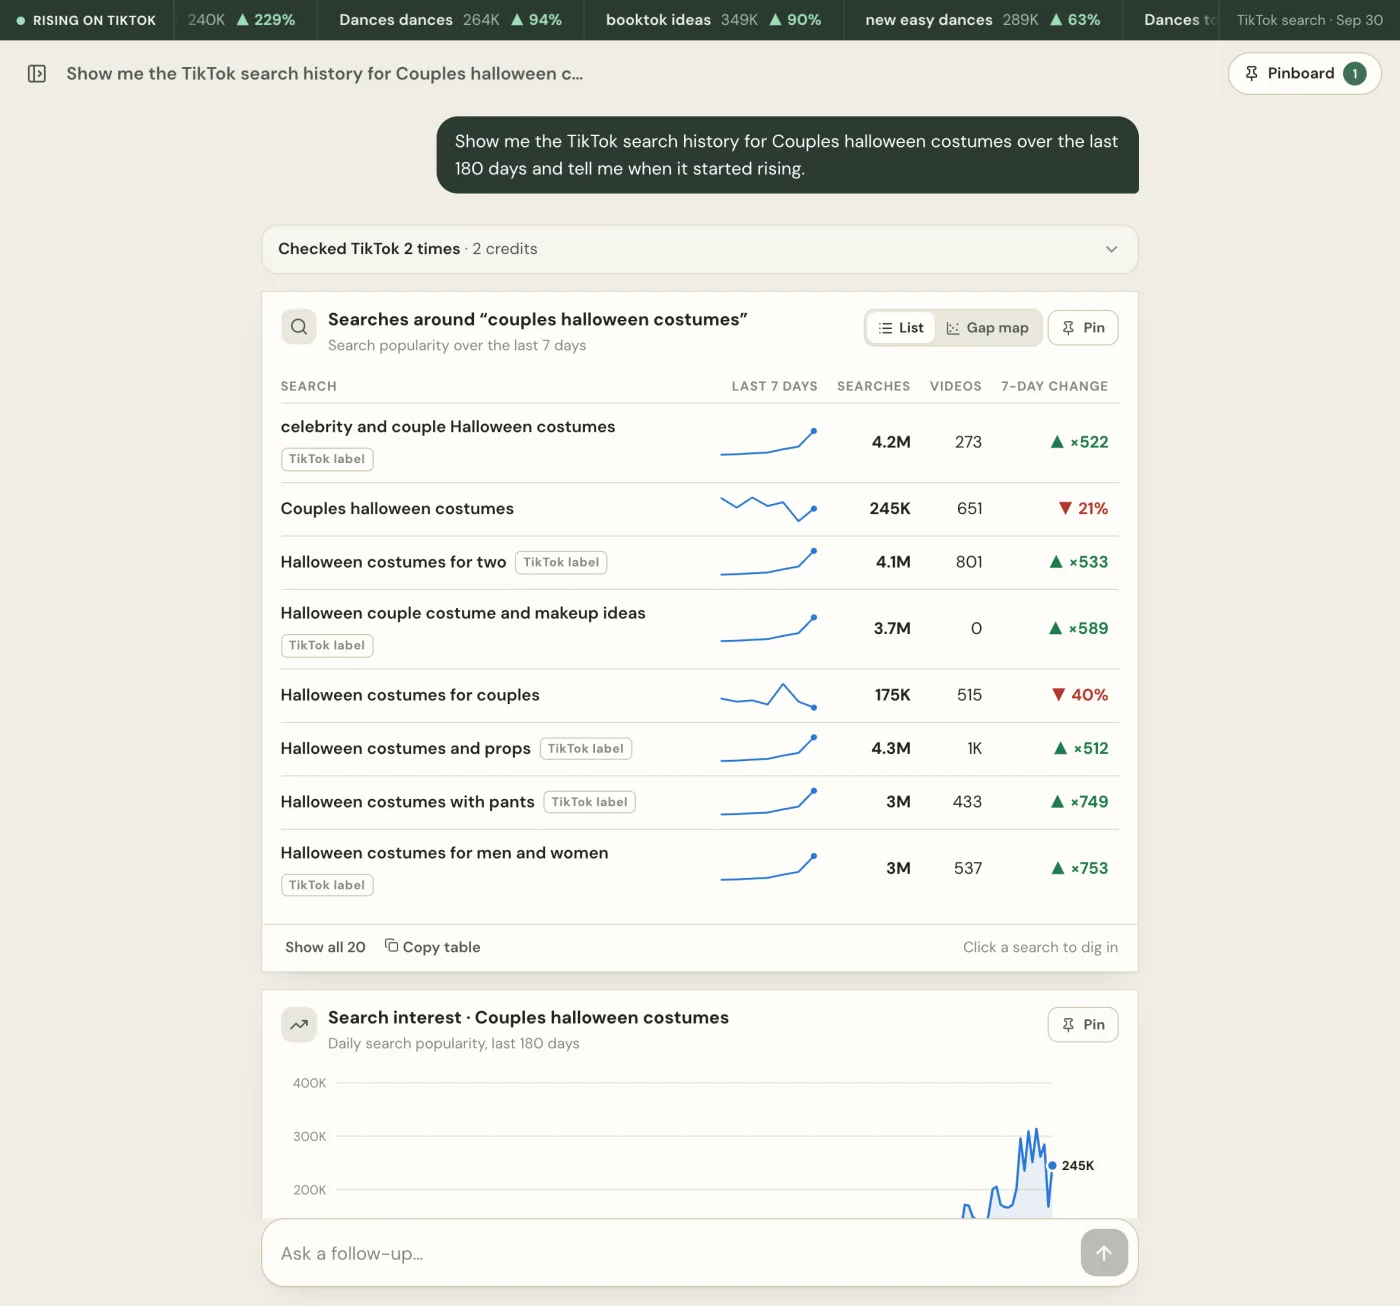
You can run the whole weekly check by asking one question at TokConnect: "Show me the 180-day TikTok search history for Couples halloween costumes and tell me when it started rising."
When we pulled that on 30 September, the history started on 3 August, since TikTok had nothing earlier for this topic. The 7-day average passed twice its first-week level on 6 September and reached 279K on 28 September, still climbing, and the topic had 634 videos when we checked on 27 September. That is a searched topic with few videos and a fixed end date, so the next step is to film this week and post well before 31 October.
Then ask the same question each Monday for your 10 to 20 searches. A question like this uses 1 to 4 credits, and the Free plan has 50.
Is the rise in "amazon travel must haves" on TikTok a real trend or a one-day spike? Check the last 30 days.
Which fall decor searches on TikTok are rising this month but still have only a few hundred videos?
How we got these numbers
On 30 September 2026 we ran four topic lookups and nine search-popularity pulls (seven 180-day, two 30-day) through TokConnect, which reads TikTok Creator Search Insights. The 30-day pulls matched the last 31 days of the 180-day series exactly. We dropped April readings, trimmed leading runs of zeros, and used a 7-day average of the daily readings throughout. The starting level is the average of 1 to 28 May for topics with full history, or of the first seven days for topics whose history starts in August. For the false-alarm test we also used our own daily snapshots of rising searches from 26 to 30 September, which feed the trends hub. Six topics are a small sample, chosen because they rose; treat the lead times as examples, not averages.
Frequently asked questions
Can you predict TikTok trends?
Partly. You can't predict which video, sound or meme will go viral. You can see many topic trends coming, because people search for them before they peak. In our data, "back to school outfits boys" showed a clear rise 70 days before its peak.
How early can you spot a TikTok trend?
For seasonal and product topics, weeks ahead. Of the six topics we measured, lead times from the first signal to the peak ran from at least 10 days (Fall Room Decor) to 70 days (back-to-school outfits). News spikes and sudden memes give almost no warning.
How long do TikTok trends last?
It varies by topic, and TikTok hasn't published an average. In our back-to-school example the rise took 70 days and the fall to half the peak took nine. Fall Room Decor dropped under half its peak 22 days after it topped out. Plan to post before the peak, not after it.
What is the best tool to predict TikTok trends?
Start with TikTok's own search data in Creator Search Insights, in the app or at tiktok.com/csi. It has no export or long history, so tools like TokConnect pull the 30- and 180-day history for you. Add TikTok Creative Center for sounds and hashtags.
Can AI predict TikTok trends?
Not on its own. A chatbot without TikTok data can only guess from what it read in training. Connected to TikTok's search numbers, it can do the weekly check for you: pull the history, compare against the last four weeks and flag the topics that doubled.
Why did a trending topic disappear a few days later?
It was probably one strong day, not a trend. Our daily list flagged booktok ideas with a 137% weekly jump, but its 180-day history was below its May level. Compare against at least four weeks and wait a second week before acting.